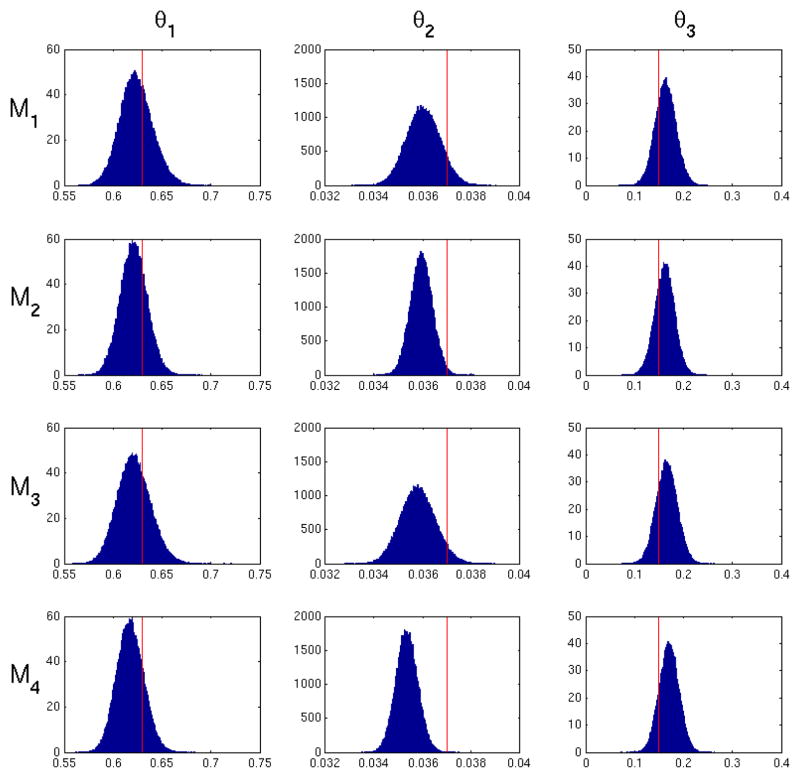
Figure 7.
Posterior probability density of the model parameters for M1–M4 for one low noise realization (CA = 0.5). The red line indicates the true parameter values. M1 and M3 exhibit the largest variance due to uncertainty in the input function. M2 has the smallest variance due to fitting the input function.

