Figure 7.
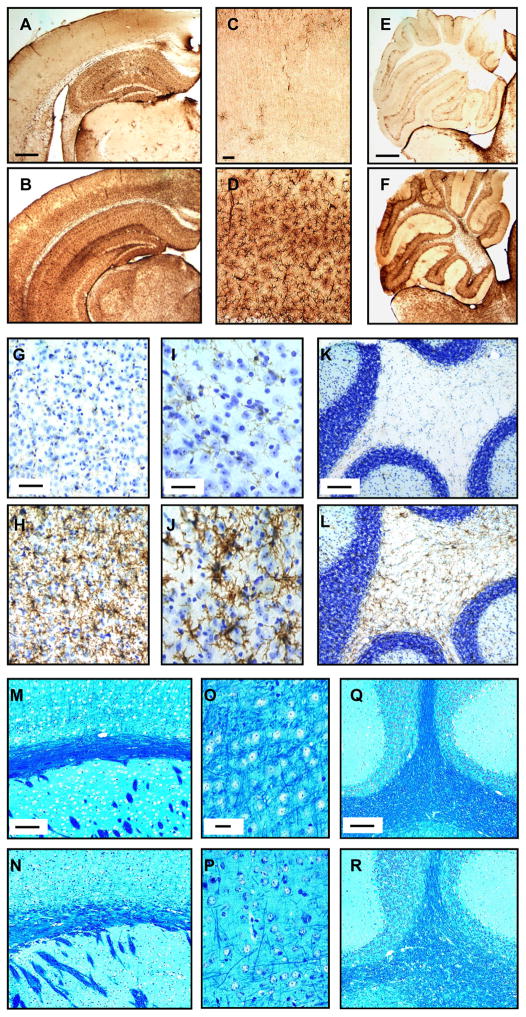
Glial involvement in the brains of Mcoln1−/− mice. (A–F) Hemi-coronal brain sections labeled by immunoperoxidase for glial fibrillary acidic protein (GFAP) show weak reactivity in the wild type (Wt) mouse (A), but strong staining throughout the cortex of the Mcoln1−/− mouse (B). Higher magnification images show GFAP staining in the neocortex of the Wt mouse (C) and the Mcoln1−/− mouse (D). GFAP staining in the cerebellum of the Wt (E) and Mcoln1−/− mouse (F) shows a similar pattern. (G–L) Microglial staining for CD11b in Wt mouse neocortex shows weak reactivity (G) compared to the Mcoln1−/− mouse (H). Similarly, there was weak staining in a Wt mouse brainstem (I) and white matter tracts of the cerebellum (K) compared to the strong immunoreactivity in brainstem (J) and cerebellum (L) of the Mcoln1−/− mouse. (M–R) Luxol fast blue staining of paraffin embedded tissue identified decreased myelination as indicated by less intense blue staining of the subcortical white matter of the Mcoln1−/− mouse (N) compared to a Wt mouse (M). There is less staining in sections of deep layer cortex and white matter tracts of the cerebellum of the Mcoln1−/− mouse (P, R) compared to a Wt mouse (O, Q). Scale bars: A and E = 500 μm and also pertain to B and F, respectively; C and G = 50 μm and pertain to D and H, respectively; I = 25 μm and pertains to J; K, M, and Q = 100 μm and pertain to L, N, and R, respectively; O = 20 μm and pertains to P.

