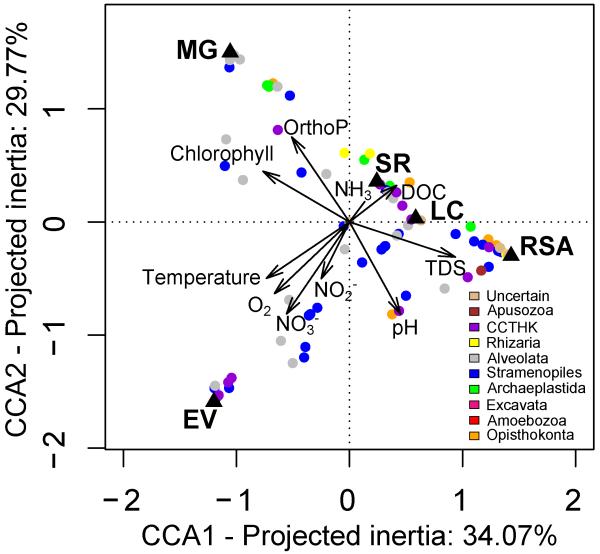
Fig. 7. Canonical Correspondence Analysis (CCA) plot.
Only 0.2-5 μm size fractions are considered. Each dot represents an OTU. The colorsindicate the taxonomic affiliation. Black triangles indicate samples. Duplicate samples appear superimposed. CCTHK: Cryptophyta, Centroheliozoa, Telonemia, Haptophyta and Katablepharida. TDS: Total Dissolved Solutes, DOC: Dissolved Organic Carbon, OrthoP: orthophosphate.

