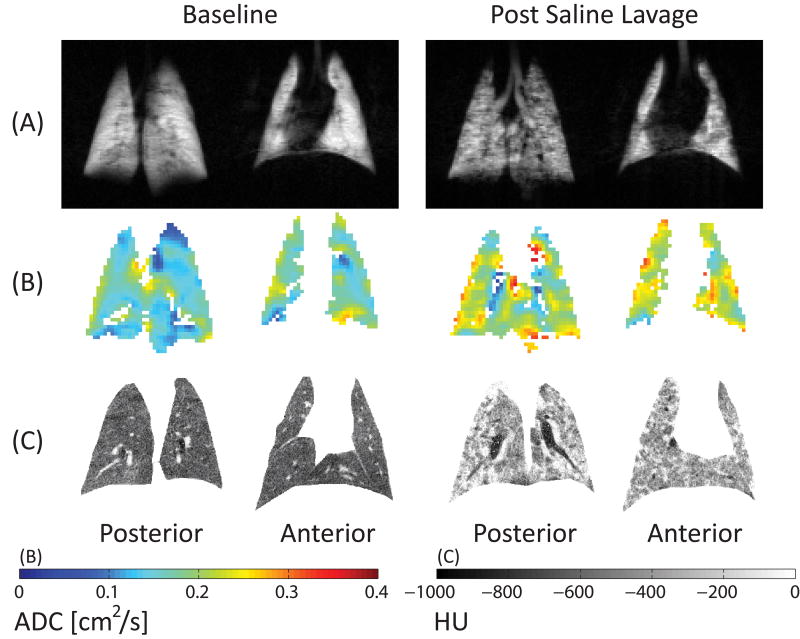
Figure 7.
Maps of 3He density (top), apparent diffusion coefficient (ADC, middle) and CT density (bottom) before and after saline lavage. Color scales for diffusion (cm2/s) and CT density (HU) are shown at the bottom. Atelectasis is documented by high CT density and low 3He signal. However, ADC was increased overall and in regions of abnormally high CT density.

