Fig. 7.
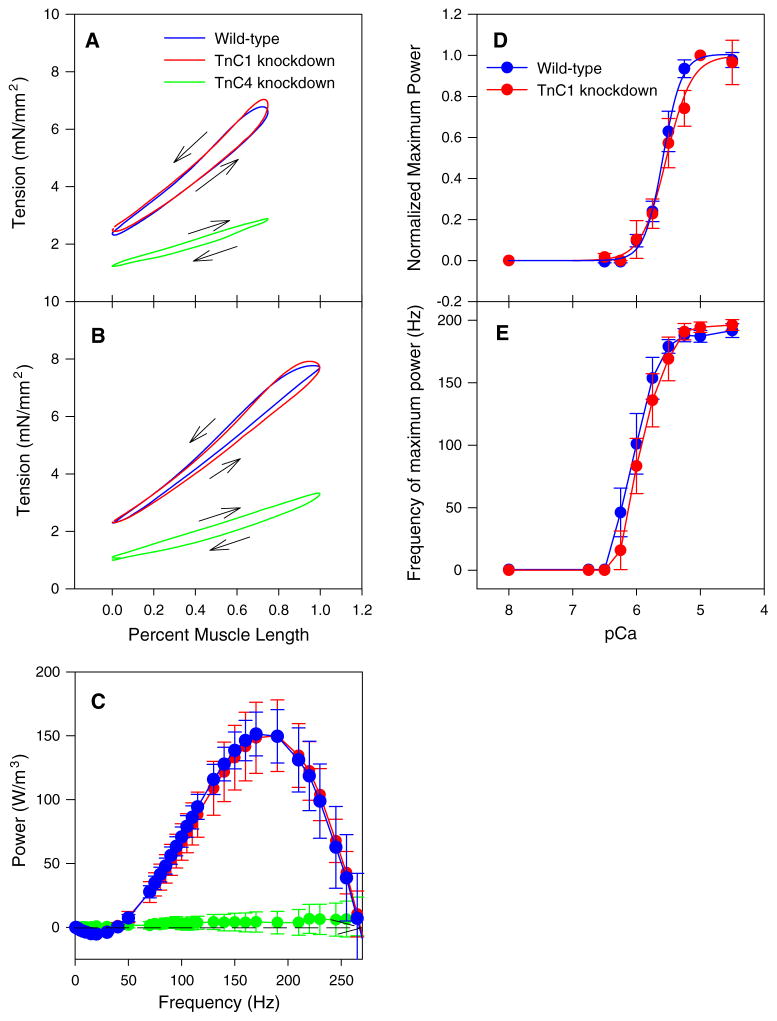
TnC4-knockdown eliminated positive work and power, but TnC1-knockdown had no effect on work or power. a Representative IFM work loops oscillated at a length change of 0.75 % ML and 100 Hz, pCa 5.0. Arrows indicate direction of work loops. Counterclockwise work loops indicate net positive work generating fibers and clockwise indicates work absorption. Both control and TnC1-knockdown fibers produced counter-clockwise work loops indicating they produce work and power while TnC4-knockdown fibers were clockwise indicating net work and power absorption. b Representative IFM work loops oscillated at a length change of 1 % ML amplitude, 125 Hz, pCa 5.0. c Power output by active (pCa 5.0) IFM fibers plotted against small amplitude, 0.125 % ML, sinusoidal oscillation frequency. No differences in the amount of power at any frequency or the frequency at which maximal power output occurs (fmax) were observed between TnC1 knockdown and WT fibers. No power was produced by TnC4-knockdown fibers at any frequency. N = 10 for both lines. d Power-pCa curve for TnC1-knockdown and WT IFMs normalized to 1 at pCa 5.0. Mean ± S.E.M. N = 12 for WT and TnC1-knockdown, N = 6 for TnC4 knockdown. e The frequency at which maximum power was generated (fmax) was the same for TnC1-knockdown and WT IFMs at all calcium concentrations. Mean ± S.E.M. N = 10 for both lines

