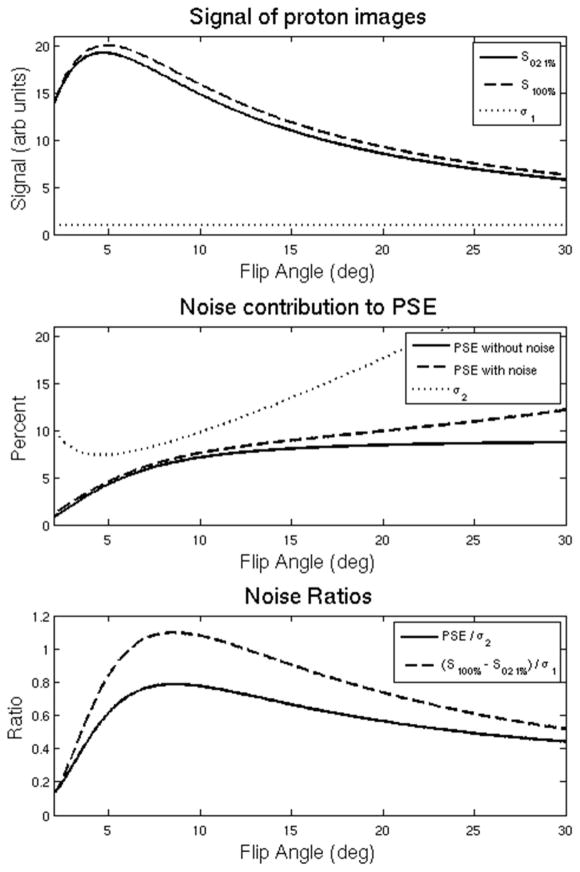
Figure 2.
(A) The predicted signal of an underlying proton voxel (solid and dashed) plotted as a function of flip angle based on Eq. 1. Zero-mean noise with standard deviation indicated by σ1 (dotted) is added. (B) The PSE as a function of flip angle assuming no noise in the proton images (solid) and adding zero mean noise σ1 to the proton voxel (dashed) based on Eq. 2. The dotted line represents the standard deviation σ2 of the noisy PSE result. (C) Normalized PSE / σ2 (solid) and the CNR of the proton voxel (dashed). Note that that PSE / σ2 and (S100% − S021%) / σ1 are both maximum at 8.4 degrees, indicating that the optimal flip angle that minimizes noise propagation in the PSE also provides the highest CNR in the difference image for the typical parameters in this work.

