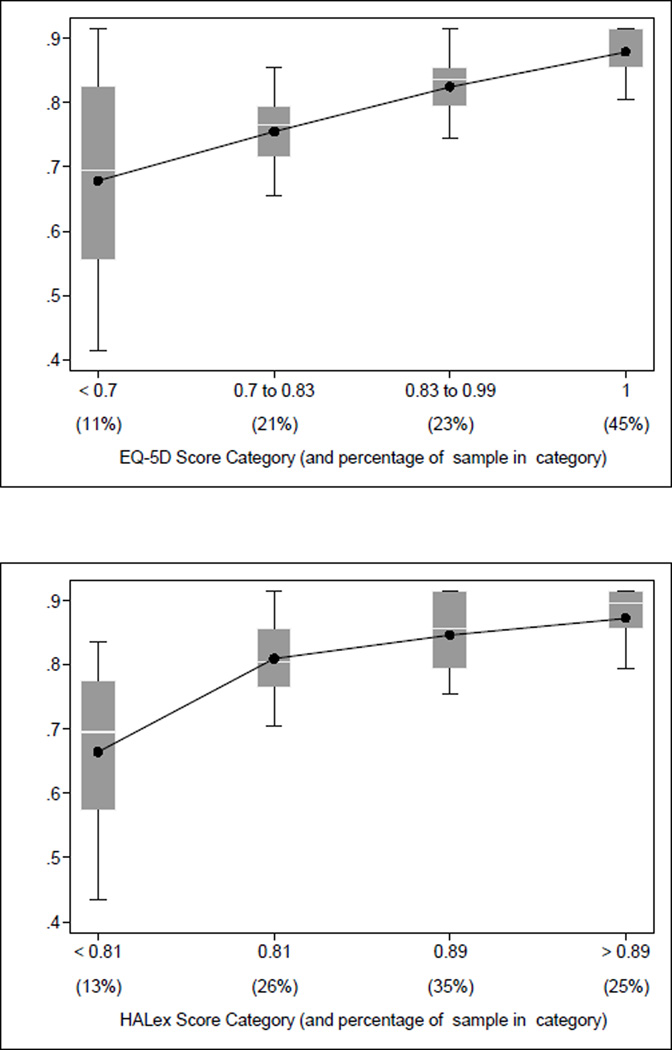
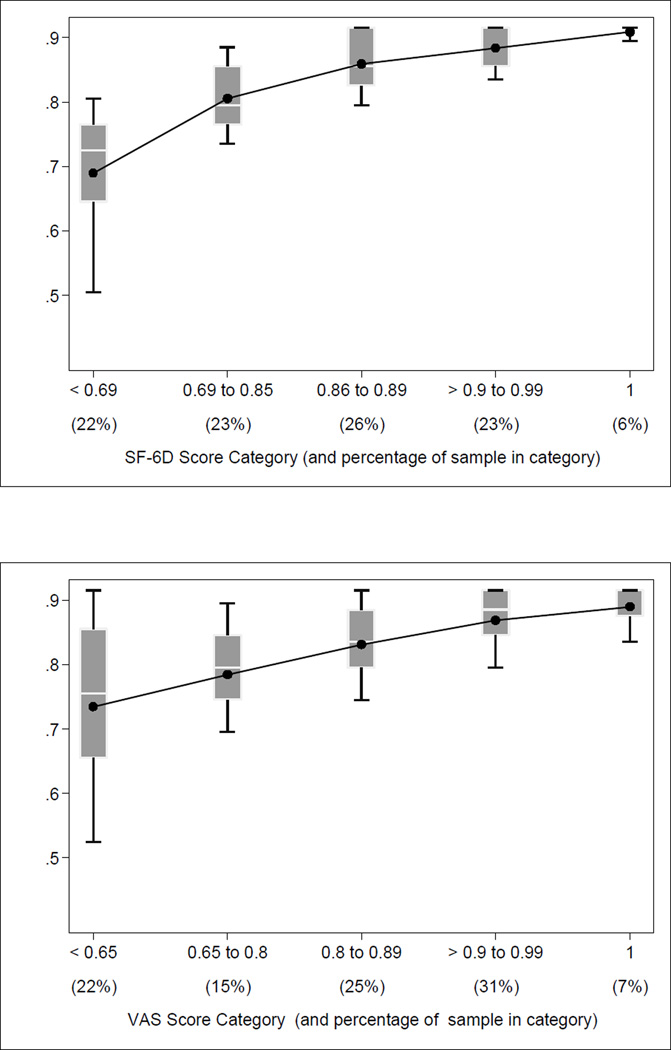
Figure 2.
Relationships Between SSI and Other Measures in Pooled MEPS Data from 2000-2002
a) Mean SSI Scores by Categories of SF-6D Scores
b) Mean SSI Scores by Categories of HALex Scores
c) Mean SSI Scores by Categories of EQ-5D Scores
d) Mean SSI Scores by Categories of VAS Scores
Line connects mean SSI scores among those in each category of the other measure. Box plots depict range of SSI scores from 25th to 75th percentile, and 10 and 90 percent confidence intervals. White line within each bar indicates median SSI score. Percentages in categories may not sum to 100 due to rounding.


