
Figure 2.
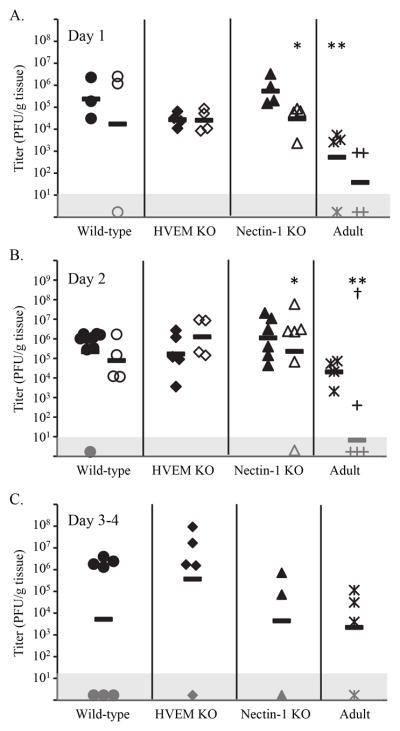
Viral titers in brain tissue at different times after IC inoculation with either HSV-1(F) (● wild-type newborns, ◆ HVEM KO newborns, ▲ nectin-1 KO newborns, * wild-type adults) or HSV-2(333) (○ wild-type newborns, ◇ HVEM KO newborns, △ nectin-1 KO newborns, + wild-type adults), in newborn mice of different genotypes or adult wild-type mice. Each symbol represents PFU per g tissue from an individual mouse, with horizontal bars indicating geometric means for each group. Symbols plotted in the gray box represent values below the detection limit of the assay. Virus was not detected in any samples from control mice inoculated in an identical manner with vehicle (PBS-GCS). Differences in titer between newborn samples for the same serotype of virus did not statistically differ based on genotype. A. Mice were sacrificed one day after inoculation (for each group of newborns, n=3–4 from a single litter). *p=0.04 vs. nectin-1 KO newborn infected with HSV-1; **p=0.05 vs. wild-type newborn infected with HSV-1. B. Mice were sacrificed two days after inoculation (for each group of newborns, n=4–9 from two separate litters). *p=0.03 vs. nectin-1 KO newborn infected with HSV-1; **p=0.002 vs. wild-type newborn infected with HSV-2, †p=0.004 vs. wild-type adult infected with HSV-1. C. Mice were sacrificed three to four days after inoculation (for each group of newborns, n=3–7 from 1–2 litters). No statistical differences were identified for replication within or between any groups.