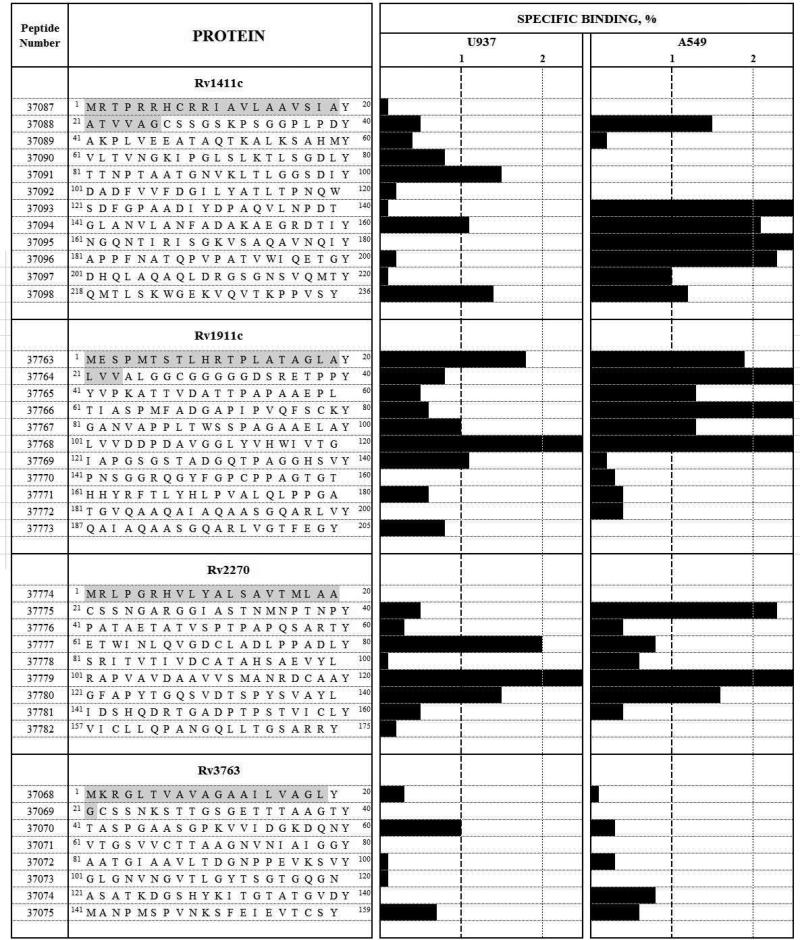
Figure 4.
Receptor-ligand assays. A549 and U937 cell binding profiles for Rv1411c, Rv1911c, Rv2270 and Rv3763 synthetic peptides. The institute's synthetic peptide serial numbers and amino acid sequences are shown on the left of the Figure. Horizontal black bars represent specific binding capacity, expressed as percentages for each peptide in both cell lines tested here. Vertical dotted lines show the 1% specific binding cut-off above which a peptide was considered to be a HABP. Signal amino acid sequences are shown in grey.

