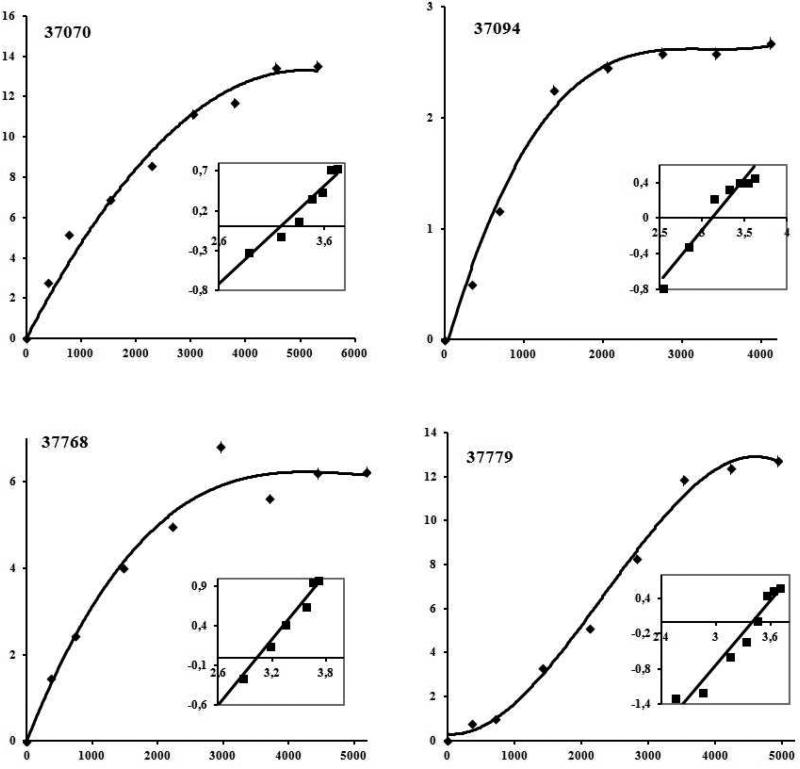
Figure 5.
Saturation curves for HABPs 37070, 37094, 37768 and 37779 which bound with high activity to U937 cells. Saturation curves were obtained by plotting the amount of specifically bound 125I-HABP against the amount of free 125I-HABP. Affinity constants and the maximum number of sites per cell were obtained from these curves by Hill analysis. Inset: the abscissa is Log F in the Hill Plot and the ordinate is Log[B/Bmax - B], Bmax being the maximum amount of bound peptide, B the bound peptide and F the free peptide.

