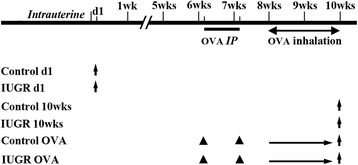
Figure 1.

Sampling age of different experimental group rats. Upward arrows represent sampling times, solid triangles represent the times of interventions, d1 represents 1 day after birth. OVA = ovalbumin; IP = intraperitoneal injections.

Sampling age of different experimental group rats. Upward arrows represent sampling times, solid triangles represent the times of interventions, d1 represents 1 day after birth. OVA = ovalbumin; IP = intraperitoneal injections.