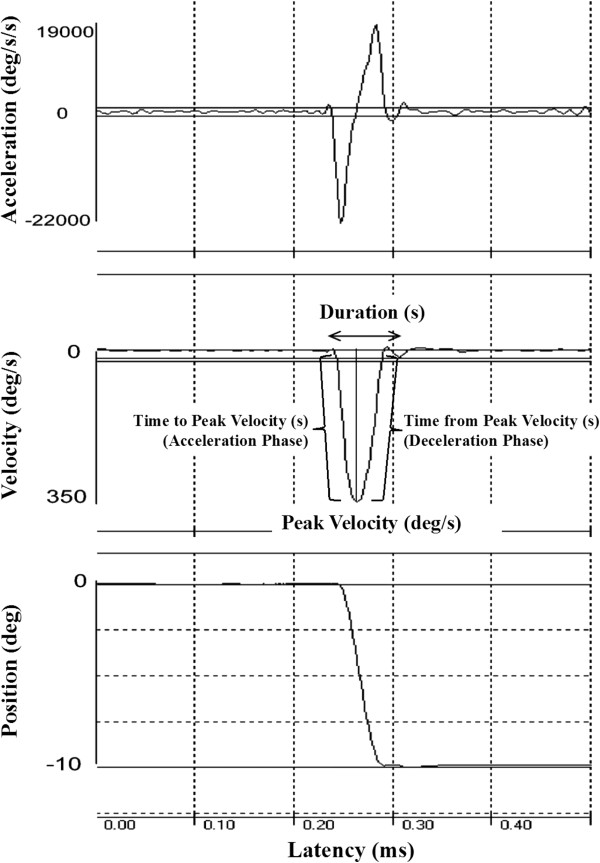
Figure 1.

A representative sample of position (bottom), velocity (middle) and acceleration/deceleration (top) traces of a single visually-guided saccade. Parameters used to define the dynamics of each saccade, including the peak velocity and duration of the movement, and the acceleration and deceleration phases of the movement are shown in the velocity trace. Deg, degrees; s, seconds.
