
Figure 6.
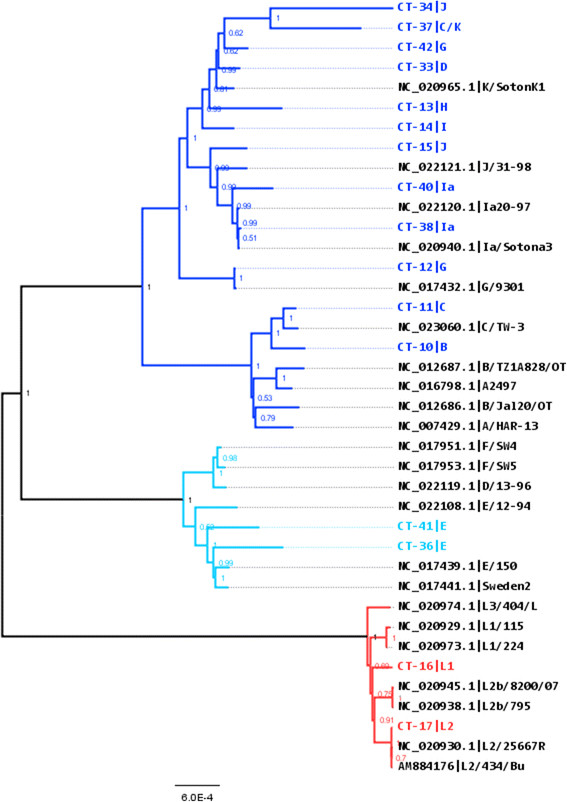
Neighbour-joining reconstruction of the phylogeny of C. trachomatis . The figure shows an un-rooted phylogenetic reconstruction of the alignment data including 8 cultured and 8 clinical C. trachomatis samples sequenced in this study and 23 C. trachomatis genomes obtained from GenBank. The Neighbour-joining tree was constructed with 500 bootstrap replicates using a Jukes Cantor model of evolution and gamma correction for among-site rate variation with four rate categories. The gap/missing data was treated with a site coverage cut-off of 90%. The blue clusters represent the ocular/urogenital biovar (dark blue T2 clade and light blue T1 clade) and the red cluster represents the LGV biovar. The ocular serovars A-C cluster within the dark blue T2 clade. The samples sequenced in this study are highlighted in colours (blue and red) and the GenBank strains are represented in black.