Figure 1.

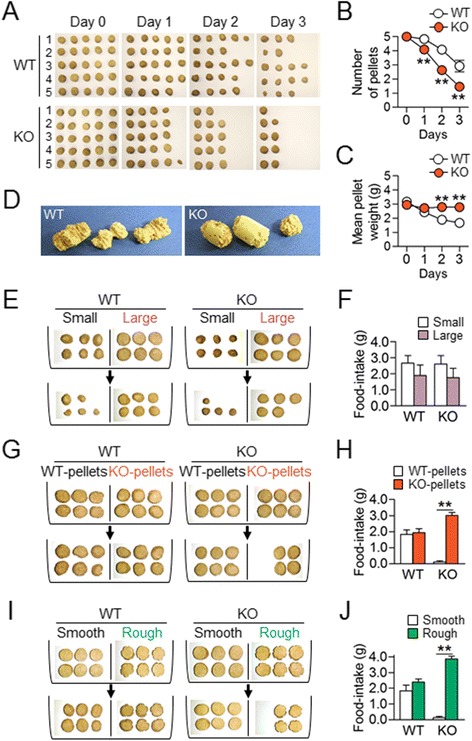
AC5 KO mice gained preferred behaviors for specific cue-directed options. (A-C) Photographs showing representative sets of food pellets consumed by 5 individuals of WT mice (WT) and AC5 KO mice (KO) for 3 days (A). Initially, five fresh food pellets were presented to each mouse and the mean number (B) and weight (C) of food pellets remaining on the next day were recorded. Two-way repeated measures ANOVA, Holm-Sidak post hoc test: for pellet numbers, genotype [F (1,20) = 17.91, p < 0.001], time [F (3,60) = 138.7, p < 0.001], and genotype × time interaction [F (3,60) = 6.935, p < 0.001]; for pellet weight, genotype [F (1,20) = 29.24, p < 0.001], time [F (3,60) = 43.13, p < 0.001], and genotype × time interaction [F (3,60) = 29.49, p < 0.001]. (D) Photographs showing cork rods chewed by WT and AC5 KO mice. Three cork rods were presented to each mouse in the absence of food pellets and the cork rods remaining on the next day were collected and photographed. (E, F) Photographs showing food-intake for small vs. large food pellets by WT and AC5 KO mice (E) and its quantification (F). Three large (1.5-2.0 cm in diameter) and three small (0.5-1.0 cm in diameter) pellets were presented to each mouse and food pellets remaining on the next day were recorded. (G-J) KO mice preferred KO food pellets to WT pellets (G, H) and rough-pellets to smooth- pellets (I, J). Three WT pellets vs. three KO pellets (G) or three rough vs. three smooth pellets (I) were presented to each mouse and food pellets remaining on the next day were recorded (H, J). Two-way ANOVA and Tukey's HSD test: for both (H, J), no genotype effect, significant food effect, and significant genotype × food interaction. Data are presented as the mean ± SEM (n = 8-11). * and ** denote the difference between indicated groups at p <0.05 and p <0.01.
