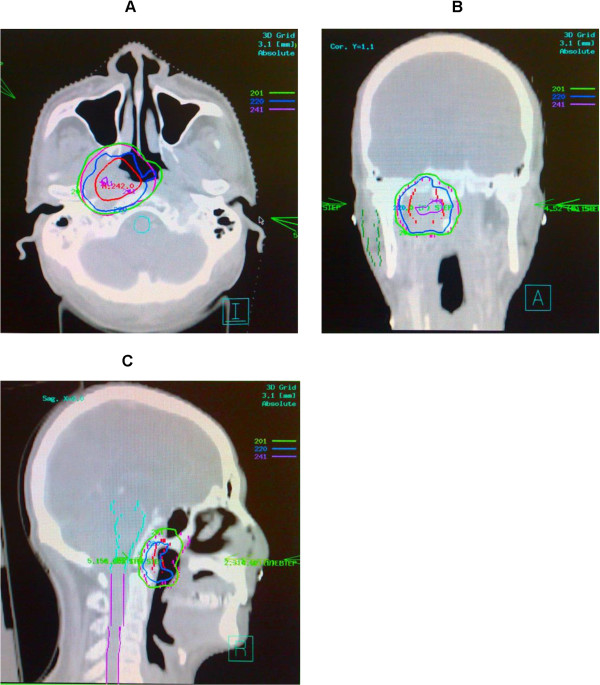
Figure 1.

CT simulation images of a patient with rT2N0M0 NPC. A: Transverse CT simulation images at the levels of superior levels of the nasopharynx illustrating target volumes, normal structures and isodose lines showing doses per fraction. B and C: Coronal (B) and Sagittal (C) CT simulation images illustrating target volumes, normal structures and isodose lines showing doses per fraction.
