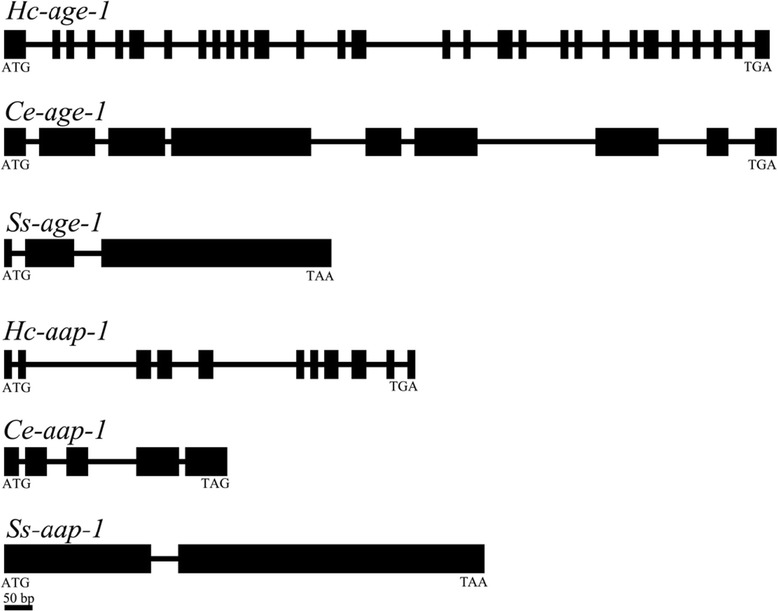
Figure 3.

Schematic diagram displaying the genomic organization of age-1 and aap-1 from Haemonchus contortus ( Hc-age-1 and Hc-aap-1 ), Caenorhabditis elegans ( Ce-age-1 and Ce-aap-1 ) and Strongyloides stercoralis ( Ss-age-1 and Ss-aap-1 ). Black boxes represent exons. Lines between the exons represent introns. Start (ATG) or stop (TAG/TGA/TAA) codons are indicated.
