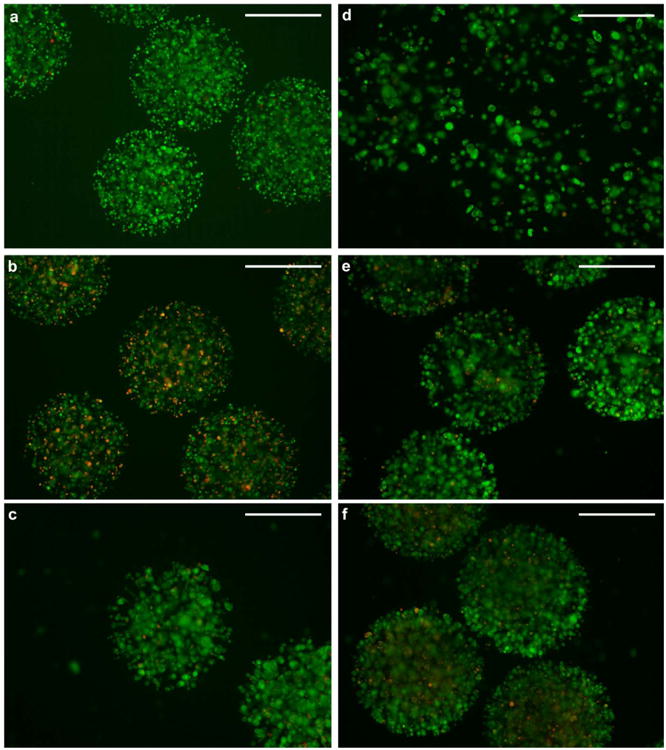
Figure 7.

Fluorescent images showing encapsulated live (green) and dead (red) cells at different time points after BES. Cells encapsulated in 1.5% food-grade alginate are shown a) one day, b) 4 days, and c) 7 days post-encapsulation. Cells encapsulated at d) 1 × 10⁶ cells ml-1 (Low), e) 5 × 10⁶ cells ml-1 (Medium), and f) 10 × 106 cells ml-1 (High). Images were taken 7 days post-encapsulation. Green fluorescence is emitted from intracellular esterase-converted calcein in live cells, whereas red fluorescence is emitted from ethidium homodimer present in the nuclei of dead cells. BES conditions were 0.4 mm inner diameter nozzle, 10 ml h-1 alginate solution flow rate, ∼7 kV applied voltage. Scale bar 500 μm.
