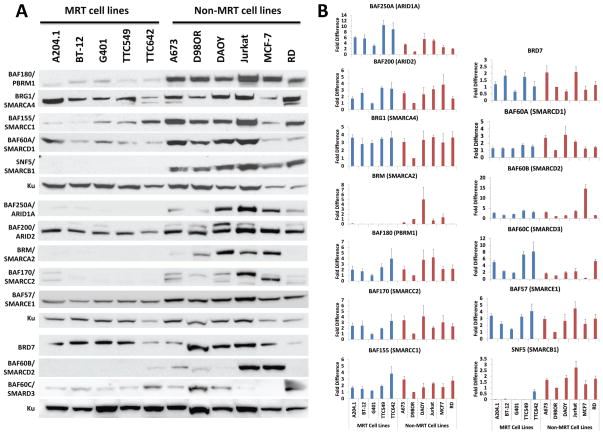
Figure 1. Decreased SWI/SNF complex protein but not mRNA in MRT cell lines.
(A) Total cellular proteins (30 μg) isolated from MRT and non-MRT cell lines were separated on a 4% to 12% SDS-polyacrylamide gel, transferred to PVDF membranes and probed with antiserum against SWI/SNF complex members. We used Ku80 as the loading control. (B) RNA was extracted from the indicated cell lines. The mRNA levels were measured for each gene by qPCR and normalized to D98OR β-actin expression. Blue- MRT cell lines; Red- non-MRT cell lines. Columns – mean of four independent experiments; Error bars – standard error.

