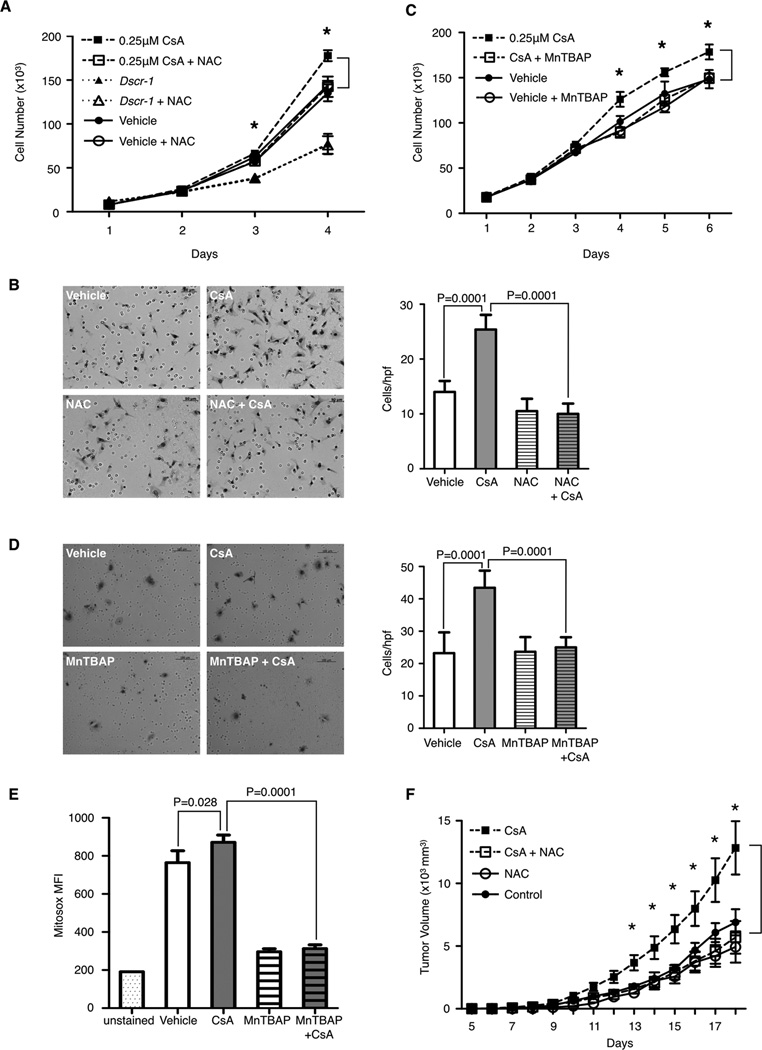
Figure 5. Antioxidant treatment abolishes cyclosporin A induced endothelial cell activation and tumorigenesis.
A & C, proliferation of LuEC after treatment with CsA plus (A) 5mM N-acetyl cysteine (NAC), or (C) 10µM Mn(III)tetrakis(4-benzoic acid)porphyrin chloride (MnTBAP). N=3 per group, with representative results of two independent experiments shown. B & D, representative images of LuEC migration through a transwell filter in response to 0.25µM CsA, (B) 5mM NAC, (D) 10µM MnTBAP, or vehicle. Scale bar, (B) 50µm, (C) 100µm. Quantification of cells per hpf is shown on the right. Representative results of two independent experiments is shown. E, quantification of Mitosox fluorescence (MFI) in LuEC treated with 0.25µM CsA or vehicle for 24 hours, with or without 10µM MnTBAP co-treatment. Representative results from two independent experiments is shown, with n=4 per group. F, B16-F10 tumor growth in WT mice ± CsA and ± NAC. Representative results of two independent experiment are shown, with n=5–9 mice per group. A-E, data are shown as mean ± SD, (F) data are shown as mean ± SEM, statistical analysis was performed by a student t-test, * P<0.05.

