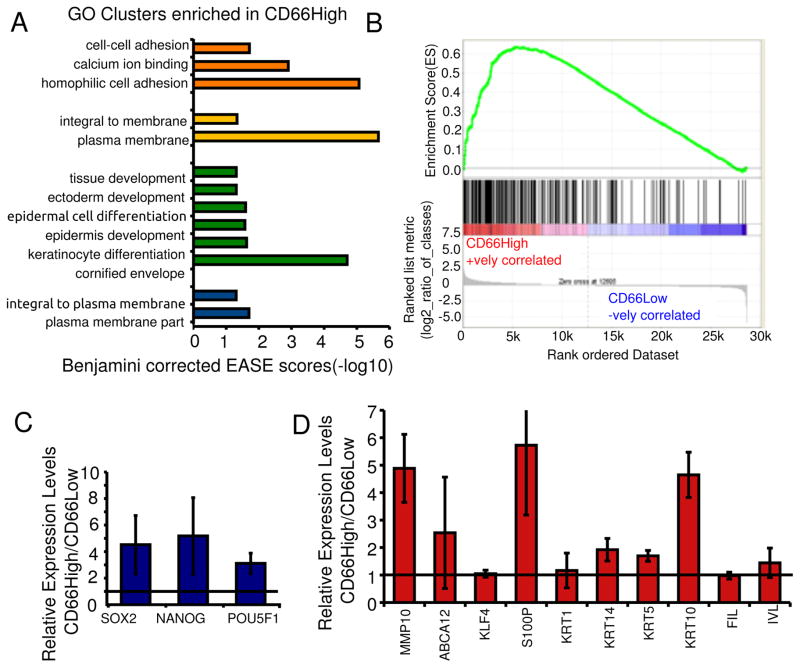
Figure 2. CD66High cells are differentiated along with progenitor/stemness profiles.
A, Genes upregulated in CD66High cells were subjected to gene ontology based classification using the DAVID gene term classification tool. The top 4 enriched clusters are shown with their Benjamini corrected EASE scores (−log10). B, GSEA analysis of gene expression profiles of CD66High and CD66Low cells compared to 216 genes up-regulated in keratinocytes upon differentiation in Ca2+ containing media (30). ES = 0.63605547, NES = 1.9540734, Nominal p-value <0.001, FDR q-value<0.001, FWER p-Value <0.001. C, Expression of pluripotency factors in sorted CD66High versus CD66Low cells from undifferentiated CIN-612 cells by real time PCR. D, Gene expression of indicated genes in sorted CD66High versus CD66Low cells from CaSki spheroids. For C and D, N= 3 sorts, error bars = S.E.M, Fold change of 1 is shown as a horizontal line.

