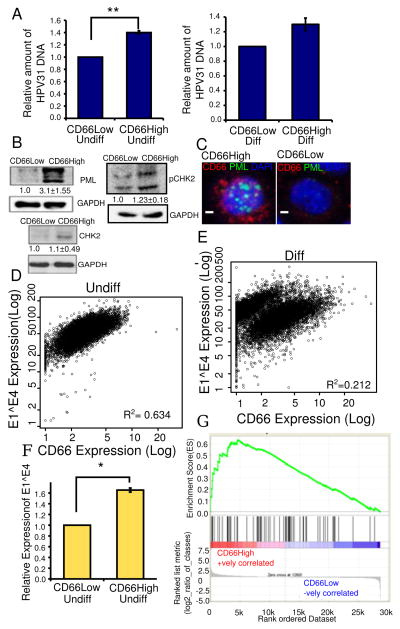
Figure 4. CD66High cells are linked to the differentiation dependent papillomavirus life cycle.
A, HPV31 DNA content in sorted CD66High versus CD66Low cells. Left: undifferentiated cultures of CIN-612, Right: differentiated in Ca2+, N=3, error bars= S.E.M., ** is p-value= 0.004, Welch’s t-test. B, Expression by western blot of PML, pCHK2 and CHK2 in sorted CD66High versus CD66Low cells from undifferentiated CIN-612 cells. GAPDH was used as a loading control. C, Expression of PML by immunofluorescence in undifferentiated CIN-612 cells, CD66c (red), PML (green), DAPI (nuclei, blue). Left: CD66High cell, right: CD66Low. Scale bar is 10μM. D,E Scatter plots showing E1^E4 and CD66 expression in 10,000 CIN-612 cells, in D, undifferentiated (Undiff) and in E, differentiated (Diff) in Ca2+. R2 =Pearson’s coefficient of correlation. F, Relative expression levels of E1^E4 in CD66Low and CD66High cells N=3, 8000 cells/experiment. Error bars are S.E.M. * is p-value=0.038, Welch’s t-test. G, GSEA analysis of gene expression profiles of CD66High and CD66Low cells compared to a 68 gene signature of cells of the squamo-columnar junction (42). ES = 0.6349658, NES = 1.7570925, Nominal p-value <0.0002, FDR q-value<0.0002, FWER p-Value <0.0002.

