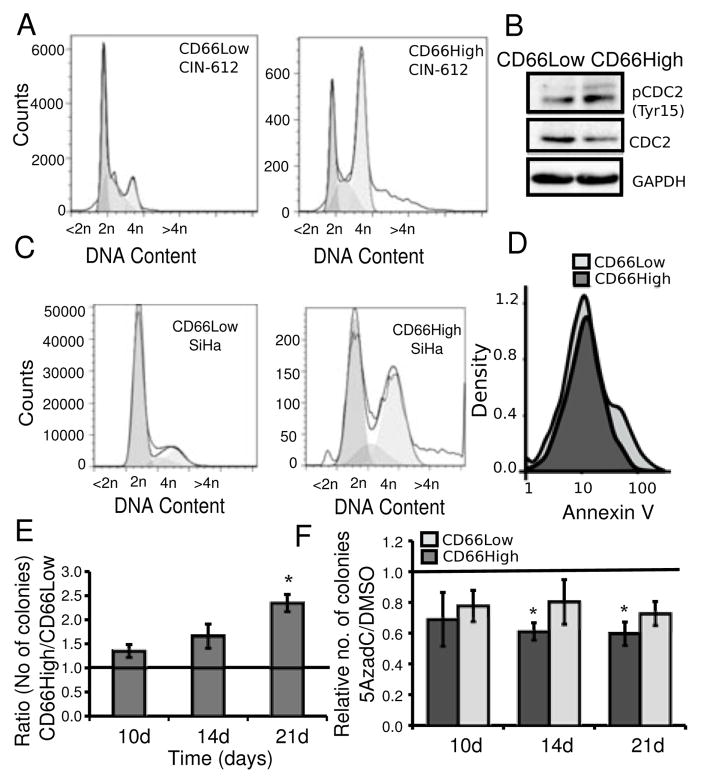
Figure 5. CD66High cells have pro-oncogenic features of survival and growth in vitro.
A, CD66High cells and CD66Low cells have distinct cell cycle profiles. Undifferentiated CIN-612 cells were stained for CD66 expression and the DNA binding dye DRAQ5. Representative plots of distribution of DNA (<2n, 2n, 4n, >4n) in CD66Low (left, 19427 cells) and CD66High (right, 19193 cells) cells. B, Expression of CDC2, pCDC2 (Tyr15) in sorted CD66Low and CD66High cells from undifferentiated CIN-612 cells. GAPDH was used as a loading control. C, SiHa cells were stained for CD66 expression and the DNA binding dye DRAQ5. Representative plots of distribution of DNA (<2n, 2n, 4n, >4n) in CD66Low (left, 1381660 cells) and CD66High (right, 17046 cells) cells. D, Binding of AnnexinV in 3000 CD66High (dark gray) and CD66Low (light gray) cells is shown in the density-plots. E, Sorted cells from undifferentiated CIN-612 cells were seeded for colony formation in soft agar. Ratio of colonies from CD66High and CD66Low cells after 10, 14 and 21 days (10d, 14d, 21d respectively), N=3 sorts, error bars = S.E.M., p-value =0.0163(*), Welch’s t-test. F, Undifferentiated CIN-612 cells were treated with 5AzadC or DMSO before sorting and seeded for colony formation in soft agar. Number of colonies from treated (5AzadC 5μM, 72 hrs)/untreated (DMSO) CD66High and CD66Low cells is plotted. Colonies were counted on day 10, 14 and 21. N= 3, error bars = S.E.M., p-values **= 0.02, *=0.032, Welch’s t-test.

