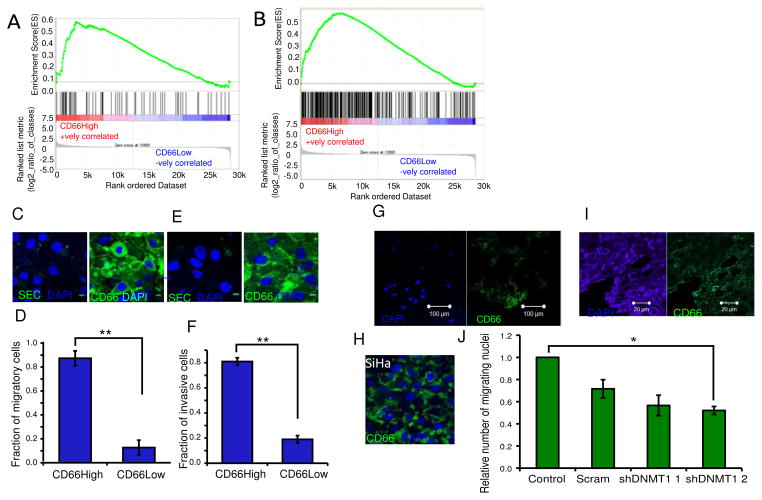
Figure 6. The neoplastic features of CD66High cells include an association with migration and invasion.
A, GSEA analysis of gene expression profiles of CD66High and CD66Low cells compared to the indicated gene set from the MsigDB (M2572). ES = 0.571464, NES = 1.5786825, Nominal p-value= 0.008526187, FDR q-value = 0.008526187, FWER p-Value= 0.007. B, GSEA analysis of gene expression profiles of CD66High and CD66Low cells compared to top 297 genes up-regulated in CaSki cells grown as Spheroids(10). ES = 0.55261254 NES= 1.741556 Nominal p-value <0.001, FDR q-value<0.001, FWER p-Value <0.001. C, CD66 staining in CIN-612 after migration, left: secondary control, right: CD66(green), DAPI (nuclei, blue). Scale bar is 10μm. D, Fraction of CD66High cells in the migratory cells from CIN-612. E, CD66 staining in CIN-612 after invasion, left: secondary control, right: CD66 (green) staining, DAPI (nuclei, blue). Scale bar is 10μm. F, Fraction of CD66High cells in the invasive cells from CIN-612. For D and F, N=3, 100 cells/experiment, error bars are S.E.M., p-value= 0.00012 and 0.0010 respectively, Welch’s t-test. G, Representative image of CD66 expression in the migratory cells from CaSki spheroids after 24 hours of migration. CD66 (right panel- green), DAPI (left panel, nuclear stain -blue). Scale bar is 100μm. H, Representative image of CD66 expression in the migratory cells from SiHa after 24 hours of migration. CD66 (green), DAPI (nuclear stain, blue). Scale bar is 10μm. I, Primary cancer section showing immunofluorescence of DAPI (left panel, nuclear stain, blue) and CD66 (right panel, green). Scale bar is 20μm. J, Effect of DNMT1 depletion on migration of CIN-612 cells. Number of migratory cells from 10 random fields were counted and fold change was calculated against untransduced control (control) and plotted for scrambled control (scram) and two shRNAs to DNMT1, shDNMT1 1 and shDNMT1 2. N=3, error bars are S.E.M. * is the p-value=0.0361, Welch’s t-test.

