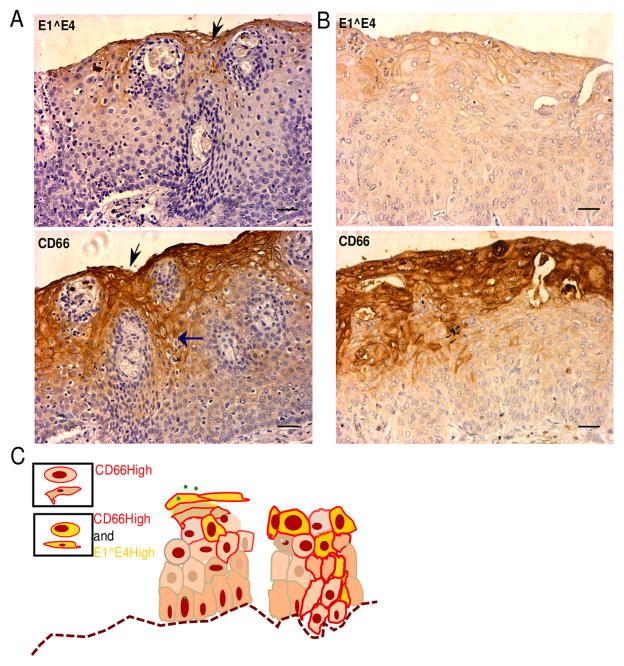
Figure 7. CD66 expression localizes to areas which also express E1^E4 and extends to the undifferentiated compartment in CINs.
A, B, Immunohistochemical analysis of CIN sections for the expression of CD66 and pan HPV E1^E4. Top panel: regions of E1^E4 expression (in brown) and bottom panel: regions of CD66 expression (in brown) from the same lesion (serial sections). Sections were counterstained with hematoxylin (blue, nuclear stain). Scale bar is 50μm. Vertical black arrows represent the corresponding regions from the two images- CD66High and E1^E4 High. Horizontal blue arrow shows CD66 staining in the lower layers. C, Schematic of CD66 and E1^E4 expression in the CINs, left: productive viral life cycle stage, right: precancerous stage.

