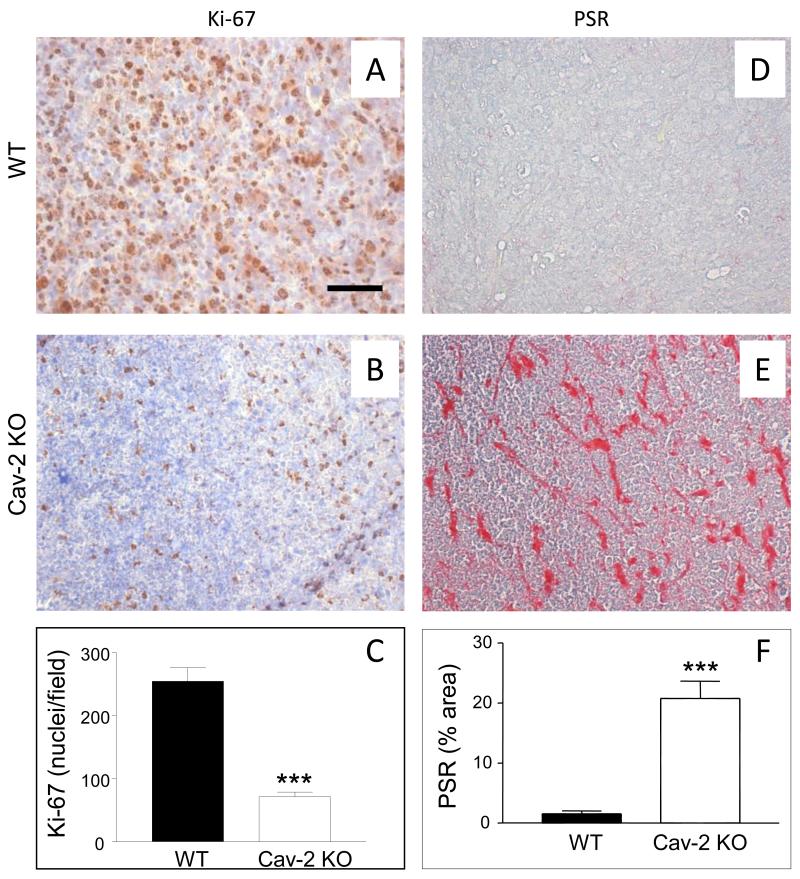
Figure 3. Cell proliferation and fibrosis within LLC tumors implanted into WT versus Cav-2 KO mice.
5-um paraffin sections of the tumor tissue extracted 10 days after s.c. implantation of LLC cells into WT and Cav-2 KO mice were immunohistochemically stained with anti-Ki-67 antibody to label proliferative nuclei (AB) or histochemically stained with picrosirius red (PSR) to label extracellular collagen as an indicator of fibrosis (DE). C: Graphical representation of the average number of Ki-67-positive nuclei per field ± S.E.M. calculated from the total of 6-7 fields derived from two sections per group. ***, P<0.0001 compared with WT by unpaired t-test (n=7 for WT and n=6 for Cav-2 KO). F: Graphical representation of fibrosis quantified based on PSR staining from 8 fields derived from two section per group and expressed as mean percent area ± S.E.M. ***, P<0.0001 compared with WT by unpaired t-test (n=8 for WT and Cav-2 KO). Bar: 50 um.

