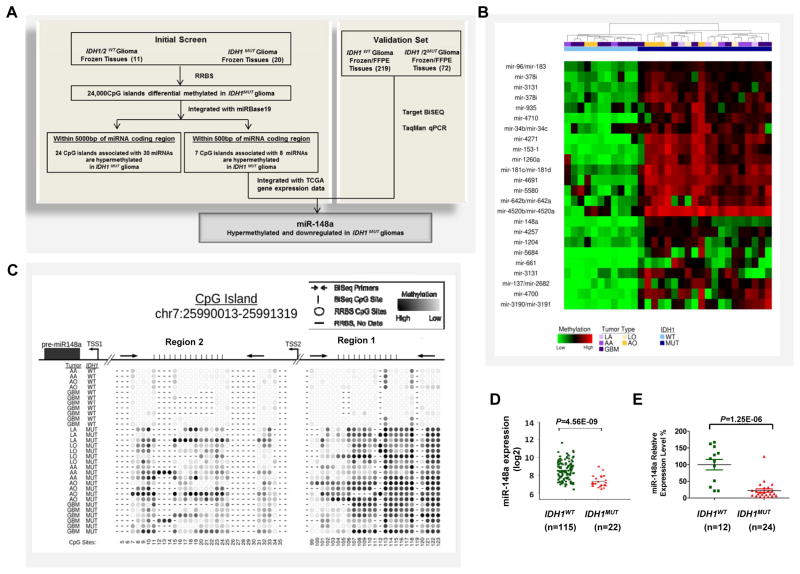
Figure 1. Discovery of hypermethylated miRNAs in glioma CpG Island Methylator Phenotype (G-CIMP).
A, schematic strategy used to identify target miRNAs in G-CIMP. B, unsupervised hierarchical clustering of differentially methylated CpG islands (P<0.05, unpaired t-test) that were identified by comparing IDH1MUT (MUT) and IDH1WT (WT) glioma patient samples using Reduced Representative Bisulfite Sequencing (RRBS). All CpG islands within 5000 bp of pre-miRNA regions are shown. C, methylation profile of the miR-148a associated CpG island via RRBS. Top panel, map of the miR-148a CpG island (chr7:25990013-25991319), position of pre-miR-148a region (black box, chr7:25989539-25989606), predicted putative transcription start sites (TSSs) and PCR products used for bisulfite sequencing in region 1 and 2 (Black arrow); bottom panel, representative CpG site methylation pattern of IDH1WT gliomas or IDH1MUT gliomas determined by RRBS. D, differential expression data for miR-148a in IDH1WT and IDH1MUT GBM from The Cancer Genome Atlas (TCGA) dataset. E, TaqMan qPCR analysis of relative miR-148a expression in IDH1WT and IDH1MUT glioma tissue samples from validation cohort. Data are standardized to the mean value for IDH1WT samples, which was set as 100%.

