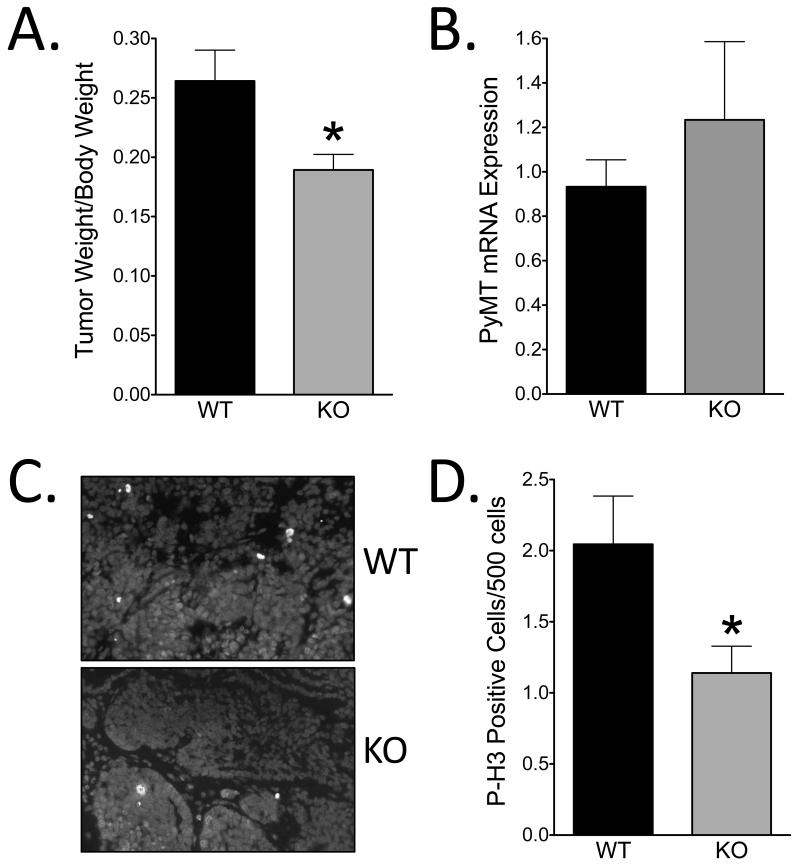
Figure 3. KO/PyMT mice have smaller tumors with decreased proliferation compared to WT/PyMT mice.
A) Tumors from WT/PyMT (n = 9) and KO/PyMT (n = 13) mice were resected and weighed at 12-13-weeks-old as a measure of tumor size. B) Quantification of PyMT gene expression relative to cytokeratin 18 from 10-week-old WT/PyMT (n = 4) and KO/PyMT (n = 4) mice. C) Images of P-histone-H3 (P-H3) staining on tumors from 12-13-week-old mice. Blue represents DAPI staining and green represents P-H3-positive cells. D) Quantification of P-H3-positive cells in tumors from WT/PyMT (n = 8) and KO/PyMT (n = 12) mice. Statistical analysis used a two-tailed Student’s t-test with a p-value threshold of 0.05.

