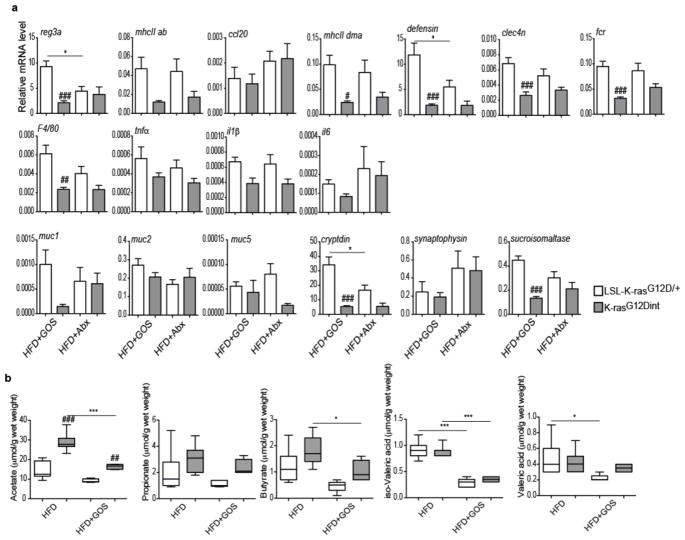
Extended Data Figure 7.
a, Relative mRNA expression levels for genes involved in immune responses, mucins and differentiation markers for Paneth, enteroendocrine, and epithelial cells using duodenum samples (HFD+GOS: LSL-K-rasG12D/+ controls n=5, K-rasG12Dint mice n=6; HFD+Abx: LSL-K-rasG12D/+ controls n=5, K-rasG12Dint mice n=6). P-values were determined by one-way ANOVA and adjusted for the number of comparisons with the Bonferroni method. Error bars indicate s.e.m. *P ≤ 0.05. #P ≤ 0.05, ##P ≤ 0.001, ###P ≤ 0.0001, compared to littermate controls. b, Prebiotic supplementation had very little or no effect on stool SCFA concentrations. (HFD: LSL-K-rasG12D/+ controls n=7, K-rasG12Dint mice n=11; HFD+GOS: LSL-K-rasG12D/+ controls n=5, K-rasG12Dint mice n=6). P-values were determined by one-way ANOVA and adjusted for the number of comparisons with the Bonferroni method. Error bars indicate s.e.m. *P ≤ 0.05, ***P ≤ 0.0001. ##P ≤ 0.001, ###P ≤ 0.0001, compared to littermate controls.

