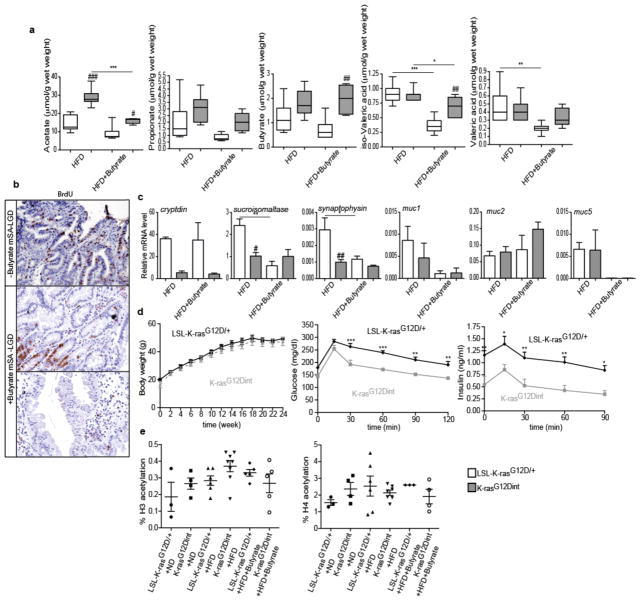
Extended Data Figure 8.
a, Sodium butyrate treatment affected butyrate and propionate concentrations in the stool only slightly when compared to prebiotic supplementation. (HFD: LSL-K-rasG12D/+ controls n=7, K-rasG12Dint mice n=11; HFD+Butyrate: LSL-K-rasG12D/+ controls n=6, K-rasG12Dint mice n=5). P-values were determined by one-way ANOVA and adjusted for the number of comparisons with the Bonferroni method. Error bars indicate s.e.m. *P ≤ 0.05, **P ≤ 0.001, ***P ≤ 0.0001. #P ≤ 0.05, ##P ≤ 0.001, ###P ≤ 0.0001, compared to littermate controls. b, Increased proliferation observed in the duodenum of K-rasG12Dint mice was decreased following butyrate supplementation. c, Expression of differentiation markers and mucins in the duodenum (HFD: LSL-K-rasG12D/+ controls n=3, K-rasG12Dint mice n=4; HFD+Butyrate: LSL-K-rasG12D/+ controls n=3, K-rasG12Dint mice n=3). P-values were determined by one-way ANOVA and adjusted for the number of comparisons with the Bonferroni method. Error bars indicate s.e.m. *P ≤ 0.05, **P ≤ 0.001. #P ≤ 0.05, ##P ≤ 0.001, compared to littermate controls. d, Butyrate employed systemic effects and protected K-rasG12Dint mice and littermate controls against HFD-induced hyperinsulinemia (n=5 per group). Data were assessed by t-test and P-values were adjusted for multiple testing. Error bars indicate s.e.m. *P ≤ 0.05, **P ≤ 0.001, ***P ≤ 0.0001. e, Butyrate treatment did not affect H3 or H4 acetylation (n= 3–8). Data was assessed with one-way ANOVA and P-values were adjusted for the number of comparisons with the Bonferroni method. Error bars indicate s.e.m. Results were not significant.

