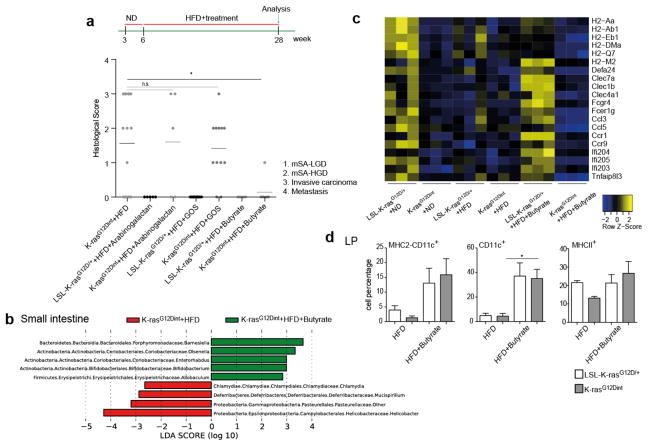
Figure 3. Butyrate supplementation, but not prebiotics, confers protection against HFD-induced tumorigenesis.
a, Experimental scheme indicates additional nutritional supplementation during HFD and the time point for data analysis. Histological scores of the small intestine in K-rasG12Dint mice on HFD (n=16) compared to that of after arabinogalactan (LSL-K-rasG12D/+ controls n=5, K-rasG12Dint mice n=5), GOS (LSL-K-rasG12D/+ controls n=10, K-rasG12Dint mice n=12) and butyrate (LSL-K-rasG12D/+ controls n=6, K-rasG12Dint mice n=7) supplementation. Each point represents one animal and lines indicate mean. The scores were assessed using one-way ANOVA and adjustments on pairwise t-tests were made using the single-step method. *P ≤ 0.05. not significant, ns. b, LEfSe results show bacteria that were statistically different among K-rasG12Dint mice on HFD treated (n=5) or not (n=8) with butyrate and indicated the effect size of each differentially abundant bacteria in the small intestine. c, The expression profiles of selected top candidate genes involved in antigen recognition, immune response, and immune cell recruitment in duodenum samples from LSL-K-rasG12D/+ controls and littermate K-rasG12Dint animals (n=3 per group). P-values were obtained from the moderated t-statistic and corrected for multiple testing with the Benjamini–Hochberg method. d, FACS analysis of LP cells from LSL-K-rasG12D/+ control and K-rasG12Dint littermate animals on HFD treated with (LSL-K-rasG12D/+ controls n=4, K-rasG12Dint mice n=7) or without (LSL-K-rasG12D/+ controls n=2, K-rasG12Dint mice n=2) butyrate. P-values were determined by one-way ANOVA and adjusted for the number of comparisons with the Bonferroni method. Error bars indicate s.e.m. *P ≤ 0.05.

