
Fig. 7.
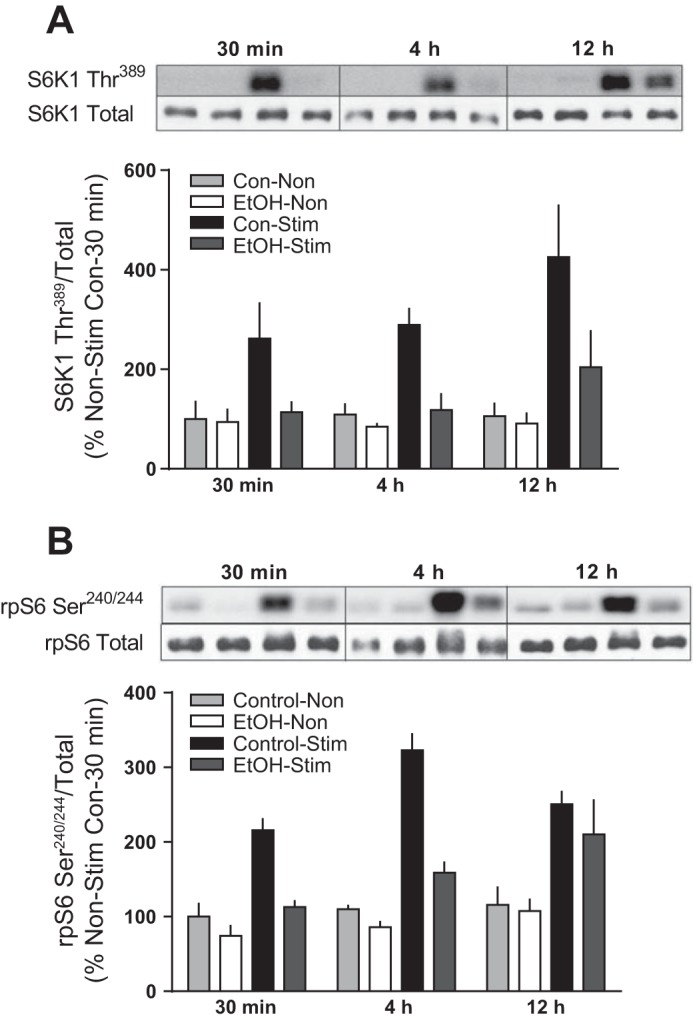
Comparison of the relative expression at each time point after alcohol and electrically stimulated muscle contraction. S6K1 Thr389 (A) and rpS6 Ser240/244 (B) were measured at 30 min, 4 h, and 12 h postmuscle contraction. Samples were resolved on the same gel, and Western blotting was performed. Bars graphs represent quantification of Western blot images normalized to the total amount of respective protein with all values set relative to the 30-min control nonstimulated value set to 100%. Shaded bars, alcohol-treated mice (n = 4); open bars, control mice (n = 4). Statistical analysis was not performed, since the graph is only representative of 4 mice/group. Values are expressed as means ± SE.