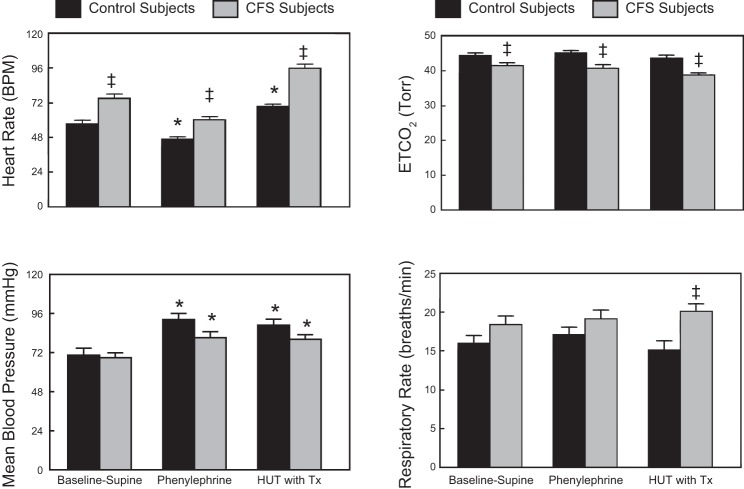
Fig. 3.
Comparison of Baseline-Supine to Baseline-Supine with phenylephrine and 60° HUT with phenylephrine (HUT with Tx) cardiorespiratory dynamics in control and CFS subjects showing mean blood pressure, heart rate, respiratory rate, and ETCO2. Data are shown as means ± SE. *Significantly different comparing Baseline-Supine to HUT (P < 0.05); ‡significantly different comparing control to CFS (P < 0.05).

