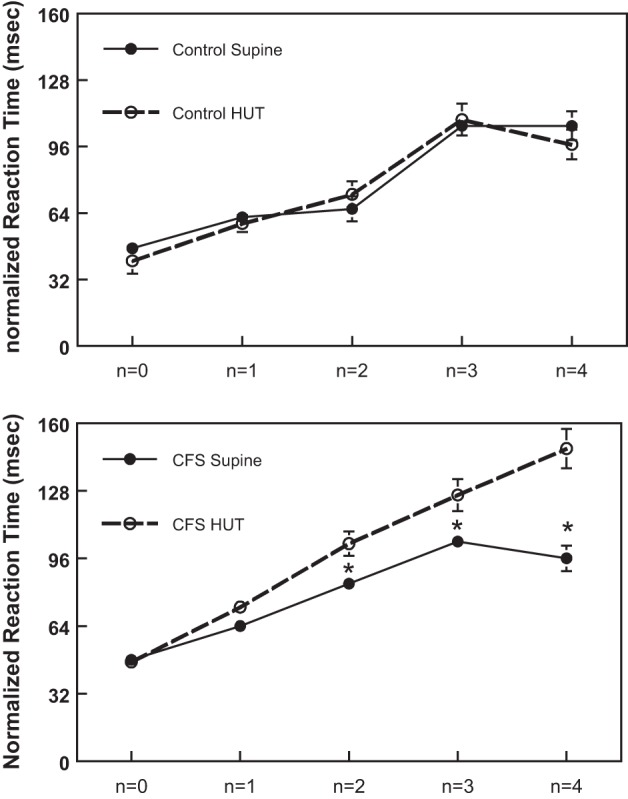
Fig. 5.

Neurocognitive function evaluated by n-back testing comparing normalized reaction time measured in control subjects (top), supine and during HUT, to that measured in CFS subjects (bottom), supine and during HUT. *Significantly different, comparing responses measured supine with those during HUT (P < 0.05).
