Abstract
Skeletal muscle fatigue is characterized by the buildup of H+ and inorganic phosphate (Pi), metabolites that are thought to cause fatigue by inhibiting muscle force, velocity, and power. While the individual effects of elevated H+ or Pi have been well characterized, the effects of simultaneously elevating the ions, as occurs during fatigue in vivo, are still poorly understood. To address this, we exposed slow and fast rat skinned muscle fibers to fatiguing levels of H+ (pH 6.2) and Pi (30 mM) and determined the effects on contractile properties. At 30°C, elevated Pi and low pH depressed maximal shortening velocity (Vmax) by 15% (4.23 to 3.58 fl/s) in slow and 31% (6.24 vs. 4.55 fl/s) in fast fibers, values similar to depressions from low pH alone. Maximal isometric force dropped by 36% in slow (148 to 94 kN/m2) and 46% in fast fibers (148 to 80 kN/m2), declines substantially larger than what either ion exerted individually. The strong effect on force combined with the significant effect on velocity caused peak power to decline by over 60% in both fiber types. Force-stiffness ratios significantly decreased with pH 6.2 + 30 mM Pi in both fiber types, suggesting these ions reduced force by decreasing the force per bridge and/or increasing the number of low-force bridges. The data indicate the collective effects of elevating H+ and Pi on maximal isometric force and peak power are stronger than what either ion exerts individually and suggest the ions act synergistically to reduce muscle function during fatigue.
Keywords: fatigue, cross-bridge cycle, power
a loss of muscular force and power characterizes the state of fatigue. Several mechanisms may explain the drop in muscular performance during fatigue including central nervous system factors (27), inhibited sarcoplasmic reticulum (SR) Ca2+ release (1), and reduced cross-bridge force production (19). Elevations in metabolites such as hydrogen ions (H+) and inorganic phosphate (Pi) have been implicated in muscle fatigue due to their concomitant increase with the decrease in muscular force (46). Studies using NMR technology of exercising humans have demonstrated a strong inverse correlation between the drop in muscular force and the rise in H+ and Pi (6, 46). In later stages of fatigue, it has been demonstrated that muscle pH can drop from 7.0 to 6.2 and that Pi can exceed 30 mM (6, 23, 32, 42).
To determine the role of these metabolites in fatigue, the skinned fiber preparation has been widely used because it allows the composition of intracellular fluid to be directly controlled while maintaining the contractile proteins in their native sarcomeric structure. Evidence from permeabilized muscle fiber experiments demonstrates a temperature dependence, such that experiments performed at lower temperatures (5–20°C) show low cell pH or elevated Pi to significantly depress peak force (Po) while low cell pH but not elevated Pi reduces maximal shortening velocity (Vmax) (31, 39). More recently, temperature jump protocols allowing single fiber experiments at near-physiological temperatures (30°C) showed depressive effects of low cell pH or elevated Pi on Po to be less pronounced (15, 28, 38) than at temperatures <25°C. However, at 30°C, the depressive effects of low cell pH on Vmax remained (15, 28).
Recently, we demonstrated low pH (6.2) plus high Pi (30 mM) to depress Po at 30°C by 40–50% in type I and II fibers (37), while Karatzaferi et al. (26) reported a 50% decline in Po in fast rabbit psoas fibers. They also observed a 20–40% drop in Vmax with the effect dependent on the degree of myosin light chain two phosphorylation (MLC2-P). While characterizing the effects of low pH plus high Pi on Vmax and Po is important, work capacity is dependent on peak power, which is obtained at intermediate velocities and forces (20). The independent effects of low pH and high Pi at low (<25°C) and near-physiological temperatures (30°C) on peak power are well known, but the effect of these ions acting together has only been studied in fast rabbit psoas fibers (26). Thus one goal of this work was to establish the effects of low pH plus high Pi on Vmax and the force-power relationship in slow as well as fast fibers.
An important property of muscle is the rate of tension development (dP/dt). This is particularly true of phasic contractions where contraction durations (and thus time for force development) are short (20). The dP/dt is thought to be limited by the forward rate constant of the transition from a low-force cross bridge (Fig. 1, state B) to the high-force state (Fig. 1, state C) and not SR Ca2+ release rate, Ca2+ diffusion, or binding to troponin-C (20). The sum of the forward and reverse rate constants (Fig. 1, step 3) determines the rate of force redevelopment (ktr) of a fully active fiber following a slack-unslack procedure (3, 4, 19). At saturating levels of Ca2+, elevating Pi accelerates ktr, and lowering pH does not change ktr at 15°C (30, 41). The collective effects of low pH plus high Pi on ktr at 15 or 30°C are unknown and were therefore evaluated in this study.
Fig. 1.
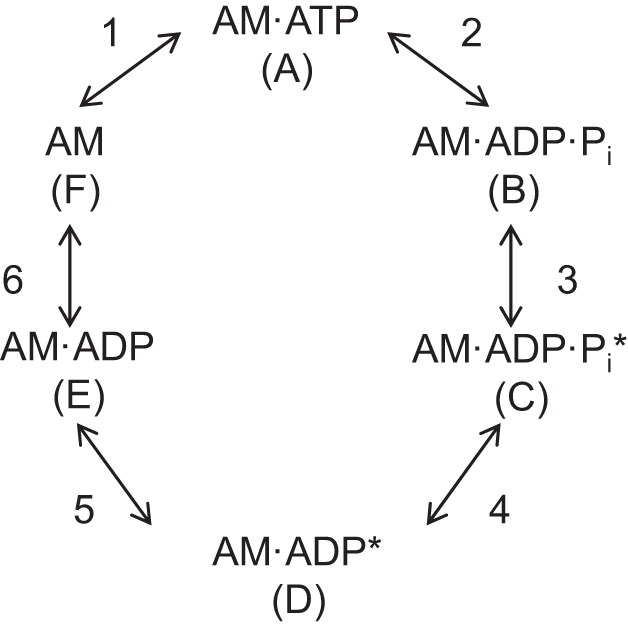
Schematic of the cross-bridge cycle. A, actin; M, myosin. *High-force cross bridge. Cross-bridge transitions are labeled with numbers and states labeled with letters in parentheses.
Fiber stiffness during activation is a reflection of the total number of cross bridges (low- and high-force states). A reduced fiber stiffness would suggest fewer bridges, while an increase in low-force bridges but no change in the total number of bridges should leave stiffness unaltered. Metzger and Moss (34) reported a fiber-type-dependent effect of low pH (6.2) on stiffness, in that stiffness was reduced at pH 6.2 in fast but not slow fibers at 15°C, suggesting a decreased number of cross-bridge attachments to actin in fast but not slow fibers. The published effects of elevated Pi on stiffness vary and are on fast fibers exclusively. One recent study described that force and stiffness were depressed equally in the presence of 25 mM Pi, leaving the force-stiffness ratio unchanged (8), while other studies have reported a decrease in the force-stiffness ratio with elevated Pi (5, 11). To our knowledge, the collective effects of elevated H+ and Pi on fiber stiffness have not been studied. We hypothesized that low pH plus high Pi will not have a significant effect on fiber stiffness in that the ions decrease force by reducing the force of the high-force cross bridge and increasing the number of low-force cross bridges rather than a reduction in the total number of cross bridges. We tested this by determining fiber stiffness and the force-stiffness ratios and by estimating the number of low-force cross bridges in control (pH 7) and pH 6.2 + 30 mM Pi conditions.
Our results quantify the depression in velocity and power elicited by pH 6.2 + 30 mM Pi in both type I and II fibers at low (15°C) and near-physiological (30°C) temperatures and provide evidence that elevations in H+ plus Pi strongly depress peak fiber power and may decrease the force per cross bridge and/or increase the number of low-force cross bridges in slow and fast fibers.
MATERIALS AND METHODS
Ethical approval.
All experiments and the protocol for animal care and disposal were approved by the Marquette University Institutional Animal Care and Use Committee.
Solutions.
Compositions for solutions were derived using an iterative computer program using stability constants contained within Fabiato and Fabiato (18), adjusted based on the temperature, pH, and ionic strength of a given solution. Relaxing (pCa 9.0) and maximal activating (pCa 4.5) solutions contained the following (in mM): 20 imidazole, 7 EGTA, 4 MgATP, and 14.5 phosphate creatine. Pi was added as K2HPO4 to yield a total concentration of 30 mM. Mg2+ was added in the form of MgCl2 with a specified free concentration of 1 mM. Ionic strength was adjusted to 180 mM for all solutions with KCl, and with solution at 15 or 30°C, the pH was adjusted to 6.2 or 7.0 with KOH. Ca2+ was added as CaCl2.
Single fiber preparation.
Male Sprague-Dawley rats (n = 13) were anaesthetized with Nembutal (50 mg/kg body wt ip) after which the soleus (type I fibers) and the deep region of the lateral head of the gastrocnemius and superficial region of the medial head of the gastrocnemius (type II fibers) were removed and placed in a 4°C relaxing solution. The rats were subsequently killed with a pneumothorax while still heavily anesthetized. Muscles were dissected into small bundles (40–50 fibers) in relaxing solution, tied to glass capillary tubes, and stored in skinning solution composed of 50% relaxing solution and 50% glycerol (vol/vol) at −20°C for ≤4 wk.
On the day of experimentation, a single muscle fiber was isolated and suspended between a force transducer (Sensor One Technologies Model AE801) and servomotor (Aurora Scientific High-Speed Length Controller Model 312C) in a setup chamber containing relaxing solution. Fibers were studied using a novel single-fiber microsystem recently developed by the laboratory of Fitts, modified from that first described by Karatzaferi et al. (25). The system (see appendix) has four individual temperature-controlled Peltier units mounted between a water-cooled stainless steel platform and 6 × 6 mm stainless steel posts that project down within 2 mm of a glass coverslip. The position and force transducers are positioned such that the fiber is suspended in 100 μl of solution between the glass slide and one of the stainless steel posts with an individual post maintained at a temperature between 10 and 30°C. The first post where the fiber is visualized has a hole drilled through it with the Peltier unit mounted on the side so that sarcomere length can be measured by laser diffraction and clamped at an optimal length during the measurement of ktr. The entire unit is mounted on a ball bearing slide so that the Peltier units can be rapidly moved to position the fiber at a given temperature.
Before experimentation, the fiber in relaxing solution was briefly (30 s) exposed to a Brij 58 (Sigma) solution to disrupt SR membranes still intact after exposure to the skinning solution. The setup post with relaxing solution in which the fiber was initially suspended was kept at 10°C while the second post was adjusted to 15 or 30°C. With the use of an inverted microscope, the fiber was viewed at ×800 and the sarcomere length was adjusted to 2.5 μm (40). Fiber length was determined by measuring the distance between the fixed points of attachment. Fiber diameter was assessed from a digital image of the fiber obtained while it was briefly suspended in air. Three measurements of fiber width were made along the fiber, and the average diameter was determined assuming a cylindrical shape (35).
Experimental design.
Contractile properties of single rat soleus and gastrocnemius fibers were determined at low (15°C) and high (30°C) temperatures in a control (pH 7, 0 mM added Pi) and experimental solution simulating fatigue (pH 6.2 + 30 mM Pi). The fibers were maintained at 10°C in relaxing solution between contractions. A given fiber was selected for either 1) force-velocity and unloaded shortening velocity (Vo) tests or 2) stiffness and ktr tests. Slow and fast fibers were subject to control and fatigue conditions, and slow fibers were stable enough to perform given experiments at both temperatures. Fast fiber experiments were conducted either at 15 or 30°C. At the end of the experiment, a final contraction in maximal calcium was performed. If the fiber's final peak force was <90% of the initial force, those data of the fiber were eliminated. All fibers were exposed to the control and fatigue conditions in a random order to control for order effects.
Vo was determined by imposing a series of rapid slack steps (100–400 μm) after the fiber was maximally activated in pCa 4.5 solution, as previously described (17, 28, 45). Fiber Vo (fl/s1) was determined from the slope of the least squares regression line of the plot of slack distance vs. the time required for the redevelopment of force.
Single fiber force-velocity parameters were determined by maximally activating the fiber and then stepping it to three submaximal isotonic loads, using custom-made software (SkinM), as previously described (28, 44). Force (as a percentage of peak) and corresponding shortening velocities were fit to the Hill equation (24) with the use of an iterative nonlinear curve-fitting procedure (Marquardt-Levenberg algorithm). Peak absolute fiber power was calculated with the fitted parameters of the force-velocity curve: Po, Vmax, and a/Po, the parameter that specifies the curvature of the force-velocity relationship (where a is a constant with dimensions of force) (44). The normalized force-velocity and force-power curves were constructed by summating velocities or power values from 0 to 100% of Po in increments of 1% (44).
Stiffness measurements were made using sarcomere length control (SL Control), developed by Dr. Kenneth Campbell (7). Fibers were vibrated at an amplitude equal to 0.05% of fiber length (mean fiber length 2.20 mm) and a frequency of 2 kHz in both relaxing and pCa 4.5 solutions. Resting or passive stiffness (measured at pCa 9.0) was subtracted from stiffness during a maximal contraction (pCa 4.5) so the data reflect the stiffness due to the cross bridge and not passive elements such as titin or collagen (32). Stiffness was calculated from the equation (Δforce per cross-sectional area in activating solution − Δforce per cross-sectional area in relaxing solution)/(Δlength) and expressed in N/mm3.
ktr Measurements were made directly following stiffness. During maximal activation, the fiber was rapidly slacked and reextended, and ktr was determined by fitting the redevelopment of tension to a single exponential equation in SL Control. The duration of the slack was 20 ms at 15°C and 10 ms at 30°C. For fast fiber ktr measurements at 15 and 30°C, sarcomere length was laser clamped at 2.5 μm to prevent sarcomere nonuniformity during tension redevelopment (33). Laser clamp was not employed with slow type I fibers, as ktr values were not different with and without the clamp (21).
To estimate the number of low-force bridges, we employed a modification of the technique of Colombini et al. (9). The technique measures cross-bridge stiffness (stiffness during activation − passive stiffness) at Po, at different force values (% of Po), and with the fiber in rigor. Colombini et al. achieved various levels of Po by blocking cross-bridge formation with N-benzyl-p-toulene sulphonamide (BTS), while we reduced force by varying solution pCa between 7.0 and 4.5. These experiments were carried out on a separate group of fibers (n = 6 for both slow and fast fibers) at 15°C. Both force and stiffness were measured at 5- to 6-pCa points for each experimental group. At the end of each experiment, the fiber was subjected to two rigor solutions in a balanced order (pH 7 and pH 6.2 + 30 mM Pi). The force and stiffness produced at a given pCa and condition were normalized to the force and stiffness obtained in rigor at the appropriate condition. The rigor solutions were similar to the activating solution described above except that ATP and creatine phosphate were not added and sufficient KCl was added to yield a total ionic strength of 180 mM (34). The normalized data were plotted as force vs. stiffness (see Fig. 9) and best-fit line extrapolated to the y-intercept. The assumption is that fiber stiffness at zero force (y-intercept) is attributed to low-force cross bridges (8).
Fig. 9.

Low-force cross-bridge percentage determined by force vs. stiffness plot. Force and stiffness elicited at a range of free Ca2+ concentrations were normalized to rigor force and stiffness in pH 7 and pH 6.2, 30 mM Pi conditions at 15°C in 6 type I (A) and 6 type II (B) fibers from a total of 3 rats. The points from each fiber are means (±SE) fit with a line and extrapolated to the ordinate, crossing a point that has stiffness but no force. Graphs show the complete range of points obtained. Insets: best fit lines, zoomed in where the lines cross the y-axis.
Myosin heavy chain composition and fiber typing.
Following the contractile measurements, fibers were solubilized in 10 μl of 1% SDS sample buffer and stored at −20°C. The myosin heavy chain profile was obtained by running samples on 7.5% (wt/vol) Tris·HCl precast gels (Bio-Rad) and stained with the Silver Stain Plus kit (Bio-Rad). Fibers were identified as type I, IIa, IIx, or IIb as previously described (37). Type IIa and IIx fibers differed in their velocity and ktr values at both 15 and 30°C. However, the depression in velocity, power, or stiffness from pH 6.2 + 30 mM Pi was not different between the IIa and IIx fiber types. Thus the data presented in this article for all parameters except ktr combined IIa and IIx fibers into a single group (no IIb fibers were included in this study). This also allowed for comparisons to previously published data (15, 16, 28).
Statistics.
Each fiber was treated as an independent observation. Data were graphed and analyzed with Graph Pad Prism 5 (San Diego, CA) using a two-way ANOVA followed by post hoc Tukey's t-tests with a significance level of 0.05.
RESULTS
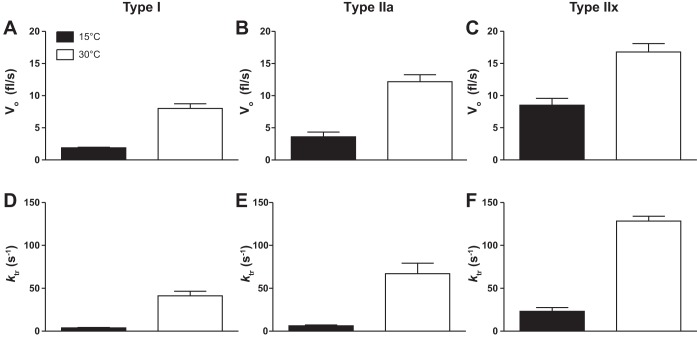
This work shows that two important kinetic measurements, velocity (Vo) and the rate constant of tension development (ktr), following a slack-unslack perturbation, evaluated at both 15 and 30°C, are highly temperature and fiber type dependent (Fig. 2). ktr Significantly increased in a fiber-type-dependent fashion (I < IIa < IIx) at both temperatures (Table 1 and Fig. 2) and was significantly higher at 30°C compared with 15°C in all fiber types. At 30°C compared with 15°C, Vo increased by 4.2-, 3.4-, and 1.9-fold type I, IIa, and IIx fibers, respectively. As temperature was elevated, fiber ktr increased by 11-, 10-, and 5.5-fold in type I, IIa, and IIx fibers, respectively. However, ktr was unaffected by pH 6.2 + 30 mM Pi at 15 or 30°C in type I or II fibers. A trend but insignificant decrease in ktr (P = 0.07) was observed in type I fibers at 30°C (Table 1).
Fig. 2.
Temperature and fiber type dependence of unloaded shortening velocity (Vo; fl/s; A–C) and ktr (s−1; D–F) at pH 7. All Vo and rate of force redevelopment (ktr) values were significantly higher at 30°C compared with 15°C and significantly increased with fiber type (I < IIa < IIx). The number of rats and fibers studied are shown in Tables 1 and 2.
Table 1.
Rate of force development is unchanged by pH 6.2 + 30 mM Pi
| 15°C |
30°C |
|||||
|---|---|---|---|---|---|---|
| n | pH 7 | pH 6.2 + 30 mM Pi | n | pH 7 | pH 6.2 + 30 mM Pi | |
| Type I | 11 | 3.8 ± 0.5 | 3.1 ± 0.4 | 10 | 41.2 ± 5.4 | 23.6 ± 7.6 |
| Type IIa | 11 | 6.2 ± 1.0* | 5.8 ± 1.8 | 7 | 66.9 ± 12.3* | 50.3 ± 13.2 |
| Type IIx | 11 | 23.1 ± 4.4*† | 30.7 ± 10.1*† | 6 | 128.4 ± 5.5*† | 122.3 ± 16.0*† |
| Type II combined | 22 | 16.1 ± 3.2* | 20.5 ± 6.5* | 13 | 95.3 ± 11.2* | 83.5 ± 14.2* |
Values are means ± SE; n, number of fibers studied where type I and type II fibers were isolated from 3 and 6 rats, respectively. Rate of force development (ktr) is a rate constant with units s−1. The ktr values at 30°C were all significantly higher than at 15°C (P < 0.05). There were no significant differences between pH 7 and pH 6.2 + 30 mM Pi conditions in any fiber type.
Significantly different from type I fibers, P < 0.05.
Significantly different from type IIa fibers, P < 0.05.
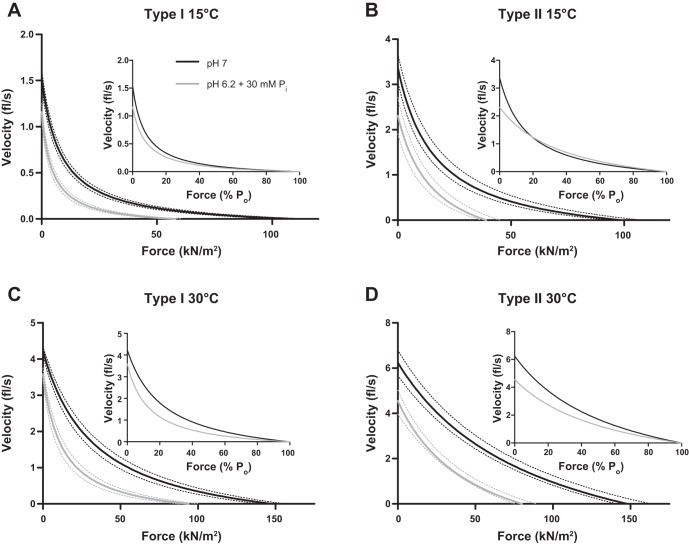
The effects of the low cell pH (6.2) and elevated Pi (30 mM) condition on velocity (Vo and Vmax) in slow and fast fibers are summarized in Table 2 and Fig. 3. Vo is typically higher than Vmax, especially at higher temperatures due to sarcomere nonuniformity that occurs with loaded contractions (44). Temperature significantly increased velocity in type I and II fibers, while pH 6.2 + 30 mM Pi significantly depressed Vo in type I fibers at 15°C, type II fibers at both 15 and 30°C, and Vmax in both fiber types at both temperatures. Raising the temperature from 15 to 30°C blunted the pH + Pi induced depression in velocity in slow but not fast fibers (Table 2). Composite force-velocity curves (Fig. 3) illustrate that fast fibers exhibit less curvature as evidenced by the significantly higher a/Po ratio (Table 2; P = 0.007 at 15°C and P = 0.009 at 30°C). For both fiber types, the a/Po ratio increased with an increase in temperature. Interestingly, pH 6.2 + 30 mM Pi had no effect on a/Po in any condition, suggesting the force-velocity relationship was uniformly decreased under these conditions.
Table 2.
Effect of pH 6.2 + 30 mM Pi on velocity and force in type I and II fibers
| n | Vo, fl/s | Vmax, fl/s | a/Po | Vopt, fl/s | Popt, kN/m2 | |
|---|---|---|---|---|---|---|
| Type I fibers, condition | ||||||
| 15°C pH 7 | 14 | 1.89 ± 0.09 | 1.53 ± 0.09 | 0.07 ± 0.01 | 0.31 ± 0.02 | 23.5 ± 1.4 |
| 15°C pH 6.2, 30 mM Pi | 14 | 1.00 ± 0.18* | 1.16 ± 0.09* | 0.08 ± 0.03 | 0.23 ± 0.01* | 11.4 ± 0.9* |
| %Change | −47 | −24 | 13 | −26 | −51 | |
| 30°C pH 7 | 12 | 8.00 ± 0.74 | 4.23 ± 0.12 | 0.27 ± 0.06 | 1.25 ± 0.07 | 41.4 ± 2.4 |
| 30°C pH 6.2, 30 mM Pi | 12 | 6.11 ± 0.79 | 3.58 ± 0.17* | 0.20 ± 0.09 | 0.91 ± 0.09* | 20.6 ± 1.1* |
| %Change | −24 | −15 | −26 | −27 | −50 | |
| Type II fibers, condition | ||||||
| 15°C pH 7 | 20 | 5.97 ± 0.78 | 3.37 ± 0.30 | 0.21 ± 0.04 | 0.85 ± 0.15 | 27.0 ± 2.4 |
| 15°C pH 6.2, 30 mM Pi | 20 | 3.58 ± 0.50* | 2.31 ± 0.40* | 0.28 ± 0.07 | 0.83 ± 0.19 | 11.8 ± 1.5* |
| %Change | −40 | −31 | 25 | −2 | −56 | |
| 30°C pH 7 | 13 | 13.48 ± 1.00 | 6.24 ± 0.56 | 0.56 ± 0.08 | 2.38 ± 0.15 | 43.8 ± 3.5 |
| 30°C pH 6.2, 30 mM Pi | 13 | 8.76 ± 0.90* | 4.55 ± 0.48* | 0.59 ± 0.09 | 1.74 ± 0.15* | 25.4 ± 2.5* |
| %Change | −33 | −31 | 5 | −27 | −39 |
Values are means ± SE n, number of fibers studied where type I and type II fibers were isolated from 4 and 6 rats, respectively. Vo, maximal shortening velocity determined from slack test; Vmax, maximal unloaded shortening velocity determined from the Hill plot test; a/Po, unitless parameter describing curvature of the force-velocity relationship; Vopt and Popt, velocity and force at peak power
Significantly different from pH 7, P < 0.05. At both pH 7 and pH 6.2, 30 mM Pi, all values at 30°C were significantly higher than 15°C.
Fig. 3.
Force-velocity curves in type I (A and C) and II (B and D) fibers at 15 and 30°C. Shortening velocity is plotted as a function of force in kilonewtons per square meter (main graphs) and as a function of percentage peak force (Po, insets). Dotted lines surrounding the average curves indicate ± SE, n = 14 and 12 for type I fibers at 15 and 30°C, respectively, and n = 20 and 13 for type II fibers at 15 and 30°C, respectively. The number of rats studied is shown in Table 2.
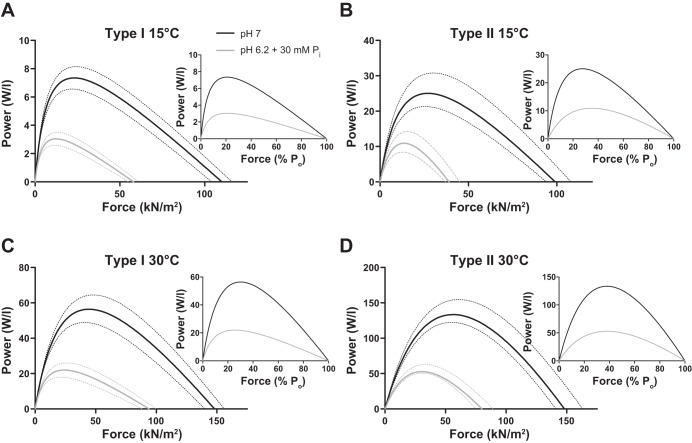
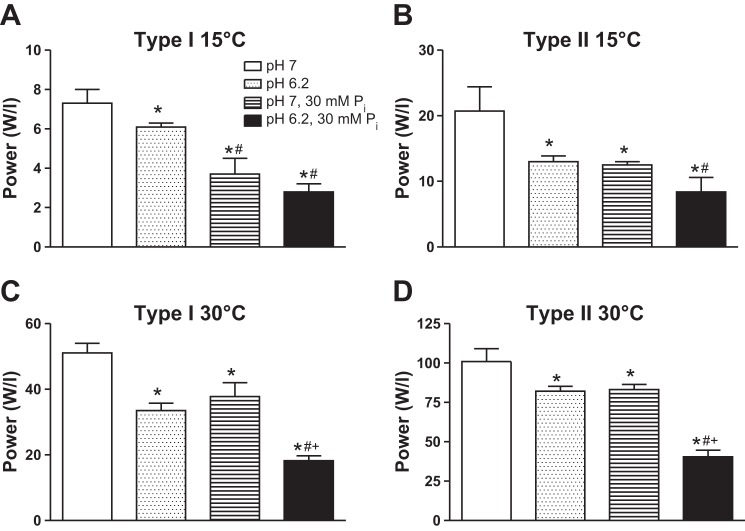
Temperature significantly increased peak power by six- to eightfold in type I and II fibers, while pH 6.2 + 30 mM Pi conditions depressed peak power in both fiber types by ∼60% at low and high temperatures (Fig. 4).
Fig. 4.
Force-power curves in type I (A and C) and II (B and D) fibers at 15 and 30°C. Power (W/l) is plotted as a function of force in kilonewtons per square meter (main graphs) and as a function of percentage Po (insets). Dotted lines surrounding the average curves indicate ± SE, n = 14 and 12 for type I fibers at 15 and 30°C, respectively, and n = 20 and 13 for type II fibers at 15 and 30°C, respectively. The number of rats studied is shown in Table 2.
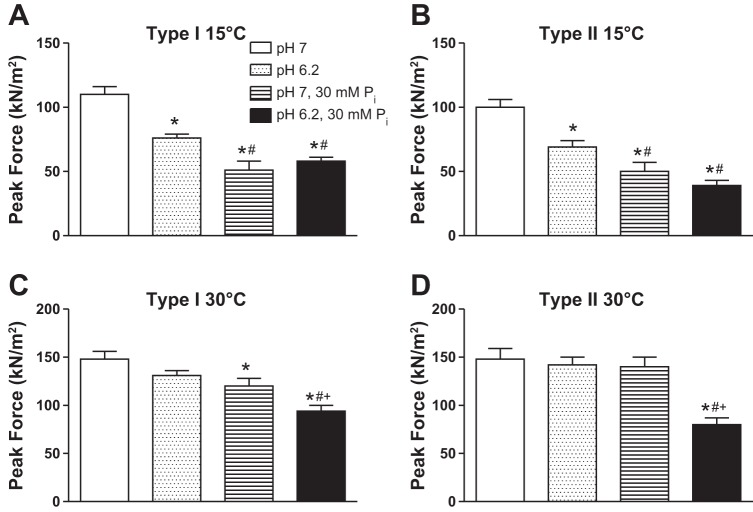
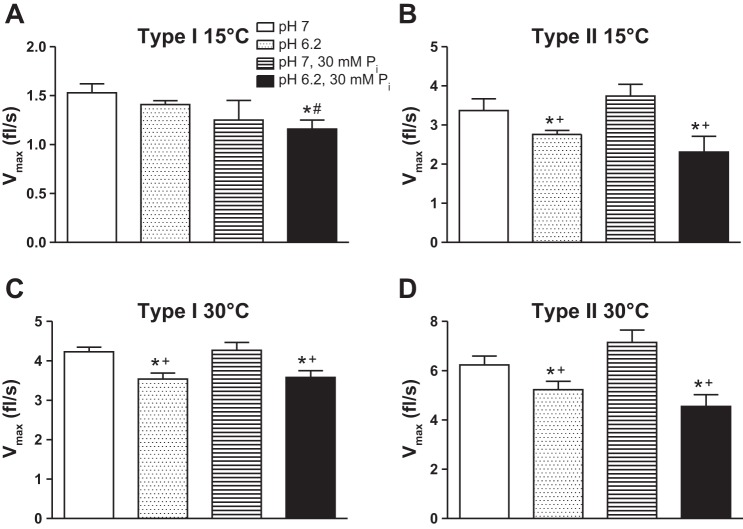
Peak force (Po), Vmax, and peak power values from previous work in our laboratory (15, 28) in which the effects of pH 6.2 and 30 mM Pi were studied individually are compared with the current study in Figs. 5–7. The individual ions significantly depressed force from control at 15°C, with the order Pi > H+, while with both ions together, the inhibition was not different from Pi alone. At 30°C, the high Pi and high Pi plus low pH conditions depressed type I force, while only the latter conditions inhibited type II fiber force (Fig. 5). Low cell pH significantly slowed Vmax in type I fibers at 30°C and type II fibers at both temperatures, while Pi had no significant effect on velocity (Fig. 6). Except for the type I fibers at 15°C, the pH + Pi induced depression in Vmax was not different than the depression of Vmax by pH 6.2 alone (Fig. 6). Individually, both pH 6.2 and 30 mM Pi significantly depressed peak power from control in type I and II fibers at both temperatures (Fig. 7). At 30°C the pH 6.2 + 30 mM Pi condition depressed peak power greater than either ion alone in both fiber types; however, at 15°C, the inhibition was not greater than that observed with higher Pi alone (P = 0.30 and P = 0.13 in type I and II fibers, respectively; Fig. 7).
Fig. 5.
Po in kN/m2 elicited at pCa 4.5 in type I (A and C) and II (B and D) fibers at 15 and 30°C. Values are means ± SE, n > 12 fibers per group with the number of rats studied shown in table 2. Data for pH 6.2 from Knuth et al. (28) and data for pH 7, 30 mM Pi modified from Debold et al. (15). *Significantly different from pH 7, P < 0.05. #Significantly different from pH 6.2, P < 0.05. +Significantly different from pH 7, 30 mM Pi, P < 0.05.
Fig. 7.
Power (W/l) in type I (A and C) and II (B and D) fibers at 15 and 30°C. Values are means ± SE, n > 12 fibers per group with the number of rats studied shown in table 2. The relative power unit of W/l is equivalent of kN·m−2·fl−1·s−1. Data for pH 6.2 from Knuth et al. (28) and data for pH 7, 30 mM Pi obtained from Debold et al. (15). *Significantly different from pH 7, P < 0.05. #Significantly different from pH 6.2, P < 0.05. +Significantly different from pH 7, 30 mM Pi, P < 0.05.
Fig. 6.
Maximal shortening velocity (Vmax) in fl/s in type I (A and C) and II (B and D) fibers at 15 and 30°C. Values are means ± SE, obtained from the Hill plot and compare individual and collective effects of pH and Pi, n > 12 fibers per group with the number of rats studied shown in Table 2. Data for pH 6.2 from Knuth et al. (28) and data for pH 7, 30 mM Pi obtained from Debold et al. (15). *Significantly different from pH 7, P < 0.05. #Significantly different from pH 6.2, P < 0.05. +Significantly different from pH 7, 30 mM Pi, P < 0.05.
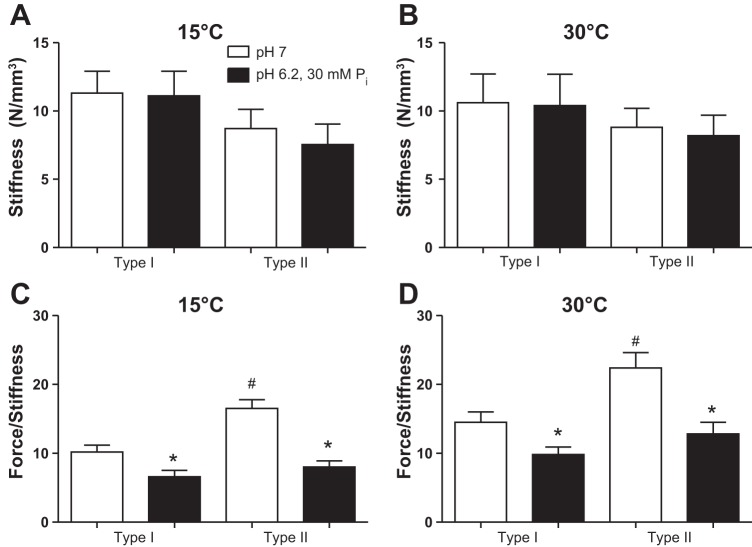
Fiber stiffness during activation, a reflection of the number of bound cross bridges (both low- and high-force states) was not different between fiber types or altered by the pH 6.2 + 30 mM Pi condition at either temperature (Fig. 8). However, the force-stiffness ratio was significantly depressed across fiber types and temperatures in pH 6.2 + 30 mM Pi conditions, suggesting an increase in the number of low-force bridges and/or reduced force of the high-force state. Type II fibers had a higher force-stiffness ratio than type I fibers in control but not pH 6.2 + 30 mM Pi conditions, implying that type II fibers either elicit more force or less stiffness per cross bridge in the nonfatigued state (Fig. 8).
Fig. 8.
Stiffness (A and B) and the force-stiffness ratio (force/stiffness) (C and D) at pCa 4.5 in type I and II fibers at 15 and 30°C. Values are means ± SE, n = 9 and 12 slow and fast fibers, respectively, at each temperature from a total of 4 rats. *Significantly different from pH 7, P < 0.05. #Significantly different than type I fibers, P < 0.05. All values in D at 30°C are significantly higher than the values in C, P < 0.05.
To further evaluate the effects of pH 6.2 + 30 mM Pi on the relative force-per-cross bridge, we employed a technique of Colombini et al. (9), described in materials and methods, in Fig. 9. The y-intercept of these plots approximates the relative percentage of low-force cross bridges. In type I and II fibers, pH 6.2 + 30 mM Pi conditions resulted in a plot with a higher y-intercept, implying a higher percentage of low-force cross bridges. The difference in the pH 7 (<1%) vs. pH 6.2 + 30 mM Pi (7%) intercept was not significantly different in type II fibers but showed a trend toward a higher intercept (P = 0.19).
DISCUSSION
The objective of this study was to determine the combined effects of high H+ and Pi on slow and fast fiber function and to provide a better understanding of how these ions alter the cross-bridge cycle. Additionally, to our knowledge, the results provide the first report of ktr in the fast fiber subtypes IIa and IIx at 30°C. Fiber ktr is thought to reflect the sum of the forward and reverse rate constants of the weak to strong binding step (Fig. 1, step 3) (3). Our finding of a 3.7-fold lower ktr (at 15°C) in the type IIa vs. IIx fiber suggests that the weak to strong binding transition is considerably slower in the IIa fiber and in fact closer to the rate observed in the slow type I fiber (Fig. 2). Interestingly, increasing temperature accelerated ktr considerably more in the slow type I and fast type IIa fiber than in fast IIx fibers. Apparently, the forward rate constant of the weak to strong binding state is less temperature sensitive in the fast IIx fiber (12).
Regarding muscle fatigue, it is known to be in part caused by H+ and Pi inhibition of force and power (19). The individual effects of these ions are well known, but the collective effects have been less studied (19, 37). Our results demonstrate that the pH 6.2 + 30 mM Pi condition significantly inhibits peak fiber force, velocity, and power in type I and II fibers at cold (15°C) and near-physiological (30°C) temperatures. Importantly, the inhibition of peak power is greater with pH 6.2 + 30 mM Pi than with either ion alone and is related to a H+ ion depression of velocity and Pi + H+ inhibition of force. The latter occurred despite no change in activated fiber stiffness, suggesting that the total number of cross bridges was unchanged.
At 30°C, the pH 6.2 + 30 mM Pi condition depressed fast fiber Vmax by ∼30%, while for type I fibers, Vmax declined by only 15%, demonstrating that under fatigue conditions, type II fibers are more susceptible to declines in velocity than type I fibers (P = 0.011). With the exception of the type I fiber at 15°C, the depression in velocity observed in the pH 6.2 + 30 mM Pi condition was not greater than that observed in the pH 6.2 condition, which implicates H+ as the primary ion depressing velocity. The increased susceptibility of the fast type II fiber may be in part due to a higher myosin light chain kinase activity (36) and higher MLC2-P. In support of this possibility, Karatzaferi et al. (26) showed MLC2-P to exacerbate the decline in fast fiber velocity observed with elevating H+ and Pi. Since MLC2-P is thought to move the myosin head close to the actin binding site for myosin, this might, under fatigue conditions, result in more low-force cross bridges, which in turn would increase drag and slow velocity (10, 19). Future studies are needed to test this hypothesis.
Low cell pH is thought to inhibit Vo by slowing ADP release from the myosin head, as evidence from in vitro motility and single molecule laser trap assays demonstrated a threefold increase in the duration of the ADP-bound state (Fig. 1, state E) (13, 14). Recently, using the in vitro motility assay, Debold et al. (14) observed pH 6.4 at 30°C to decrease actin filament velocity (Vactin), a measure analogous to unloaded shortening velocity, by over 65%. The decrease in Vactin is much larger than that observed in fibers, suggesting that the myofilament proteins and/or highly ordered architecture may attenuate some of the loss in unloaded shortening velocity with low cell pH (13).
The depressive effects of pH 6.2 or 30 mM Pi on Po are significantly attenuated at higher temperatures (Fig. 5). We have shown that at submaximal Ca2+ concentrations characteristic of fatigue, both pH 6.2 alone and 30 mM Pi alone and pH 6.2 + 30 mM Pi significantly depressed Po at 15 and 30°C (37). Here, we emphasize that although the effects of pH 6.2 or 30 mM Pi on Po at 30°C and saturating Ca2+ (pCa 4.5) are minimal, when the metabolites are elevated simultaneously, a 36 and 46% depression in Po in type I and II fibers, respectively, is apparent. The synergism of the low pH and high Pi condition could be in part caused by an increase in the H2PO43− from which is >90% of the total Pi at pH 6.2 while only ∼60% at pH 7.0. While controversial, there are data supporting the hypothesis that the deprotonated form of Pi is the primary causative agent in muscle fatigue (20).
Low cell pH and elevated Pi have been hypothesized to depress force at the same step of the cross-bridge cycle but by different mechanisms (Fig. 1, step 3) (19). It is believed that H+ slows the forward rate constant while Pi accelerates the reverse rate constant of this step. Our data on ktr and stiffness support this hypothesis. We observed no effect of pH 6.2 + 30 mM Pi conditions on ktr in slow type I or either fast fiber type at 15 or 30°C. It is known that individually, Pi increases ktr while low cell pH has no effect (30, 41). Pi is thought to increase ktr by accelerating the reverse rate constant of step 3 (Fig. 1), shifting the distribution of the cross bridges toward the low-force state (Fig. 1, state B) (41). Metzger and Moss (30) showed pH 6.2 alone to have no effect on ktr at saturating Ca2+ (pCa 4.5) but depress ktr at submaximal Ca2+. They suggested that low cell pH depressed the forward rate constant of force generation (Fig. 1, step 3) at submaximal but not maximal Ca2+ levels, with the former condition reducing the force of the strongly bound cross bridges (30). Our data show that low pH blunts the stimulatory effect of Pi on ktr, suggesting either an inhibition of the forward rate constant and/or fewer bridges transitioning from the low- to high-force state.
Peak-activated stiffness of slow and fast fibers was unchanged by the pH 6.2 + 30 mM Pi condition and, consistent with the findings of others, was independent of temperature (22). Because Po was depressed by the pH 6.2 + 30 mM Pi condition, the force-stiffness ratio decreased in both fiber types at 15 and 30°C. Since stiffness of a contracting fiber is thought to reflect the number of attached cross bridges (34), the reduced ratio could be interpreted as an increase in the number of low-force bridges (Fig. 1, state B) and/or less force per high-force cross bridge (Fig. 1, state C). A possibility exists that a Ca2+-dependent increase in stiffness due to titin contributed to total fiber stiffness and to the reduced force-stiffness ratio in the fatigue condition (29). However, these possibilities seem unlikely given the extremely small stretch amplitudes used to measure stiffness (<1 nm per half sarcomere). Stiffness due to components other than the cross bridge (presumably titin) has been shown to contribute little or no detectable tension with stretch amplitudes <10 nm per half sarcomere, and even with much larger stretches, stiffness due to titin was <2% of the total activated fiber stiffness (2).
Although not significant, we observed a trend toward an increased number of low-force bridges in type II fibers (Fig. 9). The force vs. stiffness plot, obtained by activating with various levels of Ca2+, extrapolated to the y-intercept, provides an estimate of the percentage of low-force cross bridges. The intercept did not significantly change in the pH 6.2 + 30 mM Pi conditions compared with control conditions in type II fibers (P = 0.19), but a trend toward a higher intercept is apparent. Colombini et al. (9) developed this technique using BTS to manipulate cross-bridge number, with total Ca2+ unchanged. One caution in interpreting our result where Ca2+ changed for each measurement is that Ca2+ may have effects independent of reducing force that might affect fiber stiffness or the slope of the force-stiffness plot. Nonetheless, the data in type II fibers support the hypothesis that elevating H+ and Pi shifts the distribution of cross bridges to more low-force bridges, maintaining stiffness, while decreasing fiber force and peak power.
The depression in peak fiber power in pH 6.2 + 30 mM Pi conditions was not fiber type or temperature dependent and, at 30°C, was significantly more than the power depression by low pH or high Pi alone. Taken with the observation that peak stiffness and thus the total number of cross bridges was unchanged, this suggests that the effects of pH 6.2 + 30 mM Pi are synergistic, supporting the hypothesis H+ and Pi inhibit force (and thus power) by altering the forward and reverse rate constants of step 3 of the cross-bridge cycle (Fig. 1), respectively (19). The observation that peak stiffness was unaltered by the fatigue conditions argues against a decline in the total number of bridges.
The curvature of the force-velocity relationship, defined by a unitless ratio, a/Po, increased with temperature in both fiber types. Previously, we reported the ratio to change in a fiber-type-dependent manner at 30°C by pH 6.2 or 30 mM Pi. Knuth et al. (28) found pH 6.2 to depress a/Po in type I fibers and increase a/Po in type II fibers, while Debold et al. (15) observed 30 mM Pi to decrease a/Po in both fiber types. Collectively, the ions did not alter the a/Po in either fiber type at 15 or 30°C. This is in agreement with Westerblad and Lannergren (43), who studied intact single fibers from Xenopus, stimulated them with repeated tetani to achieve fatigue, and showed no change in a/Po.
In summary, our results demonstrate that a highly significant depression in peak fiber power occurs by simultaneously elevating H+ and Pi at near-physiological temperatures. Since the important parameter for performance is peak power and not isometric force or maximal shortening velocity, these results estimate that up to 60% of power loss on the single fiber level could be due to the collective effects of low pH and elevated Pi. Furthermore, we suggest that the declines in Po observed with fatigue are in part due to the pH 6.2 + 30 mM Pi condition, reducing the force per high-force cross bridge and/or increasing the number of low-force cross bridges. This, combined with the low cell pH prolongation of the time in the AM·ADP state of the cross-bridge cycle (14), thereby depressing velocity, implicates these ions as significant mediators of skeletal muscle fatigue.
GRANTS
This work was supported by Marquette University's Department of Biological Sciences Committee on Research Funds and a Marquette University Way Klinger Fellowship (to R. H. Fitts) as well as an American Heart Association Pre-Doctoral Award (to E. P. Debold).
DISCLOSURES
No conflicts of interest, financial or otherwise, are declared by the author(s).
AUTHOR CONTRIBUTIONS
Author contributions: C.R.N., E.P.D., and R.H.F. conception and design of research; C.R.N. and E.P.D. performed experiments; C.R.N., E.P.D., and R.H.F. analyzed data; C.R.N., E.P.D., and R.H.F. interpreted results of experiments; C.R.N. prepared figures; C.R.N. drafted manuscript; C.R.N., E.P.D., and R.H.F. edited and revised manuscript; C.R.N., E.P.D., and R.H.F. approved final version of manuscript.
ACKNOWLEDGMENTS
We thank Dan Holbus and Tom Dunk for excellent technical assistance in the development of the microsystem.
Appendix
Description of microsystem.
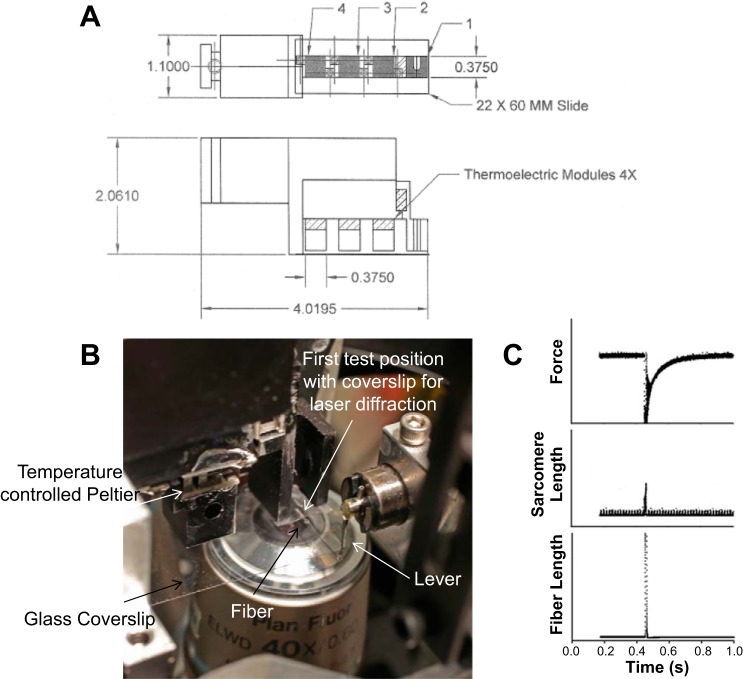
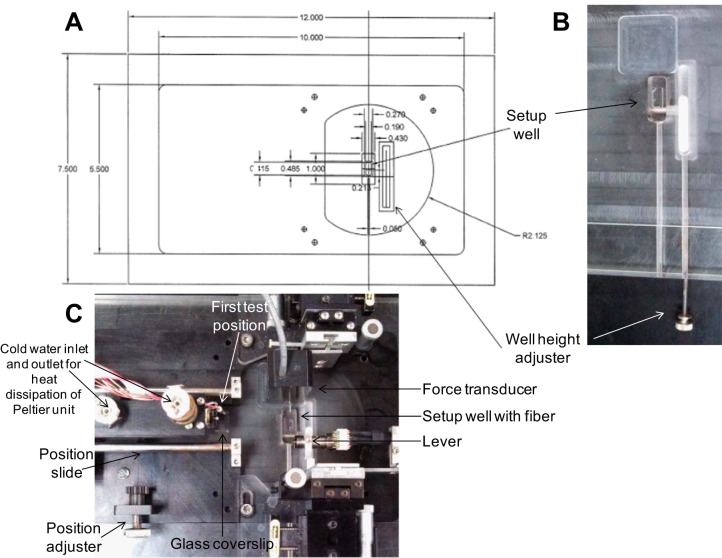
The experiments described in this article utilized a novel microsystem which is a modification of a system first described by Karatzaferi et al. (24). The system allows rapid exposure of the fiber to four different temperatures between 5 and 35°C. Figure A1A shows a top and side view of a machinist sketch of the system. Initially, the system is placed on a setup plate (Fig. A2A) that contains an adjustable well (Fig. A2B). When the well is in the up position, the force and position transducers are both submerged in the well filled with relaxing solution (Fig. A2C). After the fiber ends are attached to the transducers, the well is lowered with the well height adjuster (Fig. A2B) and the Peltier unit moved to the right with the position adjuster (Fig. A2C) so that the fiber is positioned in the first test position (Fig. A1B). The fiber is suspended between the bottom of the Peltier post and the glass coverslip in 100 μl of relaxing solution (10°C). In this position, the fiber can be viewed and sarcomere length measured and adjusted as it is directly over the inverted microscope objective (Fig. A1B). The fiber can be rapidly exposed to different temperatures and/or activating solutions by moving the four station Peltier unit to positions 2, 3, or 4 (Fig. A1, A and B). In position 1, the fiber can be immersed in solution containing fluorescent compounds monitored by epifluorescence, and laser clamp of sarcomere length can be performed. For the latter, a laser beam is diffracted up through the fiber by positioning a mirror in one of the objective ports, and the first order diffraction pattern is measured with a diode paced directly above the top of the slit in the port. This system was used in the experiments described in this article (Table 1) for measuring fast fiber ktr. Sarcomere length was clamped at 2.5 μm, the fiber was activated (pCa 4.5) and then rapidly slacked and unslacked, and ktr was measured during redevelopment of force with sarcomeres laser clamped at 2.5 μm (Fig. A1C). The clamp was removed during the slack-unslack maneuver (Fig. A1C).
Fig. A1.
A: machinist sketch of microsystem. Thermoelectric modules are Peltier temperature control units. Measurements shown in inches. B: close up of system mounted on microscope above ×40 objective. First position (where fiber is pictured) capable of laser clamp ktr measurements. C: force, sarcomere length, and fiber length vs. time in a sample ktr experiment utilizing laser clamp (this example is a IIx fiber at 15°C and had a ktr of 24.3 s−1).
Fig. A2.
A: machinist sketch of setup plate, setup well, and well height adjuster. Measurements shown in inches. B: setup well and well height adjuster in isolation. C: microsystem, setup plate, and setup well in same frame.
REFERENCES
- 1.Allen DG, Westerblad H. Role of phosphate and calcium stores in muscle fatigue. J Physiol 536: 657–665, 2001. [DOI] [PMC free article] [PubMed] [Google Scholar]
- 2.Bagni MA, Cecchi G, Colombini B, Colomo F. A non-cross-bridge stiffness in activated frog muscle fibers. Biophys J 82: 3118–3127, 2002. [DOI] [PMC free article] [PubMed] [Google Scholar]
- 3.Brenner B. Effect of Ca2+ on cross-bridge turnover kinetics in skinned single rabbit psoas fibers: implications for regulation of muscle contraction. Proc Natl Acad Sci USA 85: 3265–3269, 1988. [DOI] [PMC free article] [PubMed] [Google Scholar]
- 4.Brenner B, Eisenberg E. Rate of force generation in muscle: correlation with actomyosin ATPase activity in solution. Proc Natl Acad Sci USA 83: 3542–3546, 1986. [DOI] [PMC free article] [PubMed] [Google Scholar]
- 5.Brozovich FV, Yates LD, Gordon AM. Muscle force and stiffness during activation and relaxation. Implications for the actomyosin ATPase. J Gen Physiol 91: 399–420, 1988. [DOI] [PMC free article] [PubMed] [Google Scholar]
- 6.Cady EB, Jones DA, Lynn J, Newham DJ. Changes in force and intracellular metabolites during fatigue of human skeletal muscle. J Physiol 418: 311–325, 1989. [DOI] [PMC free article] [PubMed] [Google Scholar]
- 7.Campbell KS, Moss RL. SLControl: PC-based data acquisition and analysis for muscle mechanics. Am J Physiol Heart Circ Physiol 285: H2857–H2864, 2003. [DOI] [PubMed] [Google Scholar]
- 8.Caremani M, Dantzig J, Goldman YE, Lombardi V, Linari M. Effect of inorganic phosphate on the force and number of myosin cross-bridges during the isometric contraction of permeabilized muscle fibers from rabbit psoas. Biophys J 95: 5798–5808, 2008. [DOI] [PMC free article] [PubMed] [Google Scholar]
- 9.Colombini B, Nocella M, Bagni MA, Griffiths PJ, Cecchi G. Is the cross-bridge stiffness proportional to tension during muscle fiber activation? Biophys J 98: 2582–2590, 2010. [DOI] [PMC free article] [PubMed] [Google Scholar]
- 10.Colson BA, Locher MR, Bekyarova T, Patel JR, Fitzsimons DP, Irving TC, Moss RL. Differential roles of regulatory light chain and myosin binding protein-C phosphorylations in the modulation of cardiac force development. J Physiol 588: 981–993, 2010. [DOI] [PMC free article] [PubMed] [Google Scholar]
- 11.Dantzig JA, Goldman YE, Millar NC, Lacktis J, Homsher E. Reversal of the cross-bridge force-generating transition by photogeneration of phosphate in rabbit psoas muscle fibres. J Physiol 451: 247–278, 1992. [DOI] [PMC free article] [PubMed] [Google Scholar]
- 12.Davis JS, Epstein ND. Mechanism of tension generation in muscle: an analysis of the forward and reverse rate constants. Biophys J 92: 2865–2874, 2007. [DOI] [PMC free article] [PubMed] [Google Scholar]
- 13.Debold EP. Recent insights into muscle fatigue at the cross-bridge level. Front Physiol 3: 151, 2012. [DOI] [PMC free article] [PubMed] [Google Scholar]
- 14.Debold EP, Beck SE, Warshaw DM. Effect of low pH on single skeletal muscle myosin mechanics and kinetics. Am J Physiol Cell Physiol 295: C173–C179, 2008. [DOI] [PMC free article] [PubMed] [Google Scholar]
- 15.Debold EP, Dave H, Fitts RH. Fiber type and temperature dependence of inorganic phosphate: implications for fatigue. Am J Physiol Cell Physiol 287: C673–C681, 2004. [DOI] [PubMed] [Google Scholar]
- 16.Debold EP, Romatowski J, Fitts RH. The depressive effect of Pi on the force-pCa relationship in skinned single muscle fibers is temperature dependent. Am J Physiol Cell Physiol 290: C1041–C1050, 2006. [DOI] [PubMed] [Google Scholar]
- 17.Edman KA. The velocity of unloaded shortening and its relation to sarcomere length and isometric force in vertebrate muscle fibres. J Physiol 291: 143–159, 1979. [DOI] [PMC free article] [PubMed] [Google Scholar]
- 18.Fabiato A, Fabiato F. Calculator programs for computing the composition of the solutions containing multiple metals and ligands used for experiments in skinned muscle cells. J Physiol (Paris) 75: 463–505, 1979. [PubMed] [Google Scholar]
- 19.Fitts RH. The cross-bridge cycle and skeletal muscle fatigue. J Appl Physiol 104: 551–558, 2008. [DOI] [PubMed] [Google Scholar]
- 20.Fitts RH. Cellular mechanisms of muscle fatigue. Physiol Rev 74: 49–94, 1994. [DOI] [PubMed] [Google Scholar]
- 21.Fitzsimons DP, Patel JR, Campbell KS, Moss RL. Cooperative mechanisms in the activation dependence of the rate of force development in rabbit skinned skeletal muscle fibers. J Gen Physiol 117: 133–148, 2001. [DOI] [PMC free article] [PubMed] [Google Scholar]
- 22.Galler S, Hilber K. Tension/stiffness ratio of skinned rat skeletal muscle fibre types at various temperatures. Acta Physiol Scand 162: 119–126, 1998. [DOI] [PubMed] [Google Scholar]
- 23.Hermansen L, Osnes JB. Blood and muscle pH after maximal exercise in man. J Appl Physiol 32: 304–308, 1972. [DOI] [PubMed] [Google Scholar]
- 24.Hill AV. The heat of shortening and the dynamic constants of muscle. Proc R Soc B 126: 136–195, 1938. [Google Scholar]
- 25.Karatzaferi C, Chinn MK, Cooke R. The force exerted by a muscle cross-bridge depends directly on the strength of the actomyosin bond. Biophys J 87: 2532–2544, 2004. [DOI] [PMC free article] [PubMed] [Google Scholar]
- 26.Karatzaferi C, Franks-Skiba K, Cooke R. Inhibition of shortening velocity of skinned skeletal muscle fibers in conditions that mimic fatigue. Am J Physiol Regul Integr Comp Physiol 294: R948–R955, 2008. [DOI] [PubMed] [Google Scholar]
- 27.Kent-Braun JA, Fitts RH, Christie A. Skeletal muscle fatigue. In: Comprehensive Physiology, edited by Terjung R. Columbia, MO: John Wiley & Sons, 2012, p. 997. [DOI] [PubMed] [Google Scholar]
- 28.Knuth ST, Dave H, Peters JR, Fitts RH. Low cell pH depresses peak power in rat skeletal muscle fibres at both 30 degrees C and 15 degrees C: implications for muscle fatigue. J Physiol 575: 887–899, 2006. [DOI] [PMC free article] [PubMed] [Google Scholar]
- 29.Labeit D, Watanabe K, Witt C, Fujita H, Wu Y, Lahmers S, Funck T, Labeit S, Granzier H. Calcium-dependent molecular spring elements in the giant protein titin. Proc Natl Acad Sci USA 100: 13716–13721, 2003. [DOI] [PMC free article] [PubMed] [Google Scholar]
- 30.Metzger JM, Moss RL. pH modulation of the kinetics of a Ca2(+)-sensitive cross-bridge state transition in mammalian single skeletal muscle fibres. J Physiol 428: 751–764, 1990. [DOI] [PMC free article] [PubMed] [Google Scholar]
- 31.Metzger JM, Moss RL. Greater hydrogen ion-induced depression of tension and velocity in skinned single fibres of rat fast than slow muscles. J Physiol 393: 727–742, 1987. [DOI] [PMC free article] [PubMed] [Google Scholar]
- 32.Metzger JM, Fitts RH. Role of intracellular pH in muscle fatigue. J Appl Physiol 62: 1392–1397, 1987. [DOI] [PubMed] [Google Scholar]
- 33.Metzger JM, Greaser ML, Moss RL. Variations in cross-bridge attachment rate and tension with phosphorylation of myosin in mammalian skinned skeletal muscle fibers. Implications for twitch potentiation in intact muscle. J Gen Physiol 93: 855–883, 1989. [DOI] [PMC free article] [PubMed] [Google Scholar]
- 34.Metzger JM, Moss RL. Effects of tension and stiffness due to reduced pH in mammalian fast- and slow-twitch skinned skeletal muscle fibres. J Physiol 428: 737–750, 1990. [DOI] [PMC free article] [PubMed] [Google Scholar]
- 35.Metzger JM, Moss RL. Shortening velocity in skinned single muscle fibers. Influence of filament lattice spacing. Biophys J 52: 127–131, 1987. [DOI] [PMC free article] [PubMed] [Google Scholar]
- 36.Moore RL, Stull JT. Myosin light chain phosphorylation in fast and slow skeletal muscles in situ. Am J Physiol Cell Physiol 247: C462–C471, 1984. [DOI] [PubMed] [Google Scholar]
- 37.Nelson CR, Fitts RH. Effects of low cell pH and elevated inorganic phosphate on the pCa-force relationship in single muscle fibers at near-physiological temperatures. Am J Physiol Cell Physiol 306: C670–C678, 2014. [DOI] [PubMed] [Google Scholar]
- 38.Pate E, Bhimani M, Franks-Skiba K, Cooke R. Reduced effect of pH on skinned rabbit psoas muscle mechanics at high temperatures: implications for fatigue. J Physiol 486: 689–694, 1995. [DOI] [PMC free article] [PubMed] [Google Scholar]
- 39.Pate E, Cooke R. Addition of phosphate to active muscle fibers probes actomyosin states within the powerstroke. Pflügers Arch 414: 73–81, 1989. [DOI] [PubMed] [Google Scholar]
- 40.Stephenson DG, Williams DA. Effects of sarcomere length on the force-pCa relation in fast- and slow-twitch skinned muscle fibres from the rat. J Physiol 333: 637–653, 1982. [DOI] [PMC free article] [PubMed] [Google Scholar]
- 41.Tesi C, Colomo F, Nencini S, Piroddi N, Poggesi C. The effect of inorganic phosphate on force generation in single myofibrils from rabbit skeletal muscle. Biophys J 78: 3081–3092, 2000. [DOI] [PMC free article] [PubMed] [Google Scholar]
- 42.Thompson LV, Fitts RH. Muscle fatigue in the frog semitendinosus: role of the high-energy phosphates and Pi. Am J Physiol Cell Physiol 263: C803–C809, 1992. [DOI] [PubMed] [Google Scholar]
- 43.Westerblad H, Lannergren J. Changes of the force-velocity relation, isometric tension and relaxation rate during fatigue in intact, single fibres of Xenopus skeletal muscle. J Muscle Res Cell Motil 15: 287–298, 1994. [DOI] [PubMed] [Google Scholar]
- 44.Widrick JJ, Trappe SW, Costill DL, Fitts RH. Force-velocity and force-power properties of single muscle fibers from elite master runners and sedentary men. Am J Physiol Cell Physiol 271: C676–C683, 1996. [DOI] [PubMed] [Google Scholar]
- 45.Widrick JJ. Effect of Pi on unloaded shortening velocity of slow and fast mammalian muscle fibers. Am J Physiol Cell Physiol 282: C647–C653, 2002. [DOI] [PubMed] [Google Scholar]
- 46.Wilson JR, McCully KK, Mancini DM, Boden B, Chance B. Relationship of muscular fatigue to pH and diprotonated Pi in humans: a 31P-NMR study. J Appl Physiol 64: 2333–2339, 1988. [DOI] [PubMed] [Google Scholar]


