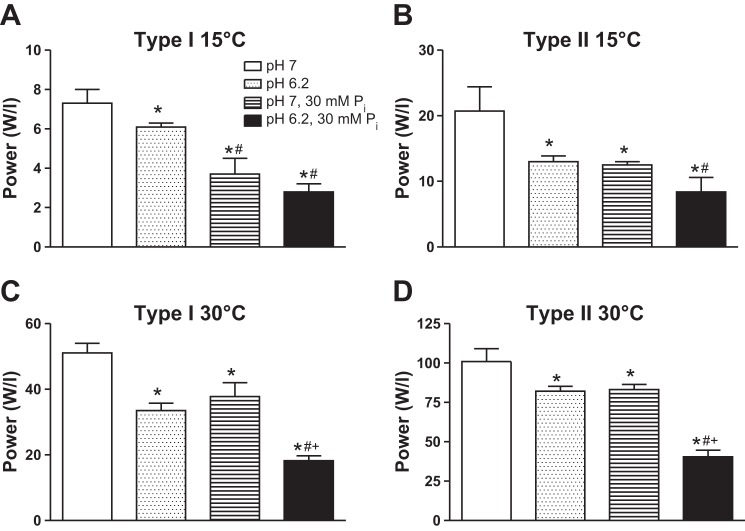
Fig. 7.
Power (W/l) in type I (A and C) and II (B and D) fibers at 15 and 30°C. Values are means ± SE, n > 12 fibers per group with the number of rats studied shown in table 2. The relative power unit of W/l is equivalent of kN·m−2·fl−1·s−1. Data for pH 6.2 from Knuth et al. (28) and data for pH 7, 30 mM Pi obtained from Debold et al. (15). *Significantly different from pH 7, P < 0.05. #Significantly different from pH 6.2, P < 0.05. +Significantly different from pH 7, 30 mM Pi, P < 0.05.

