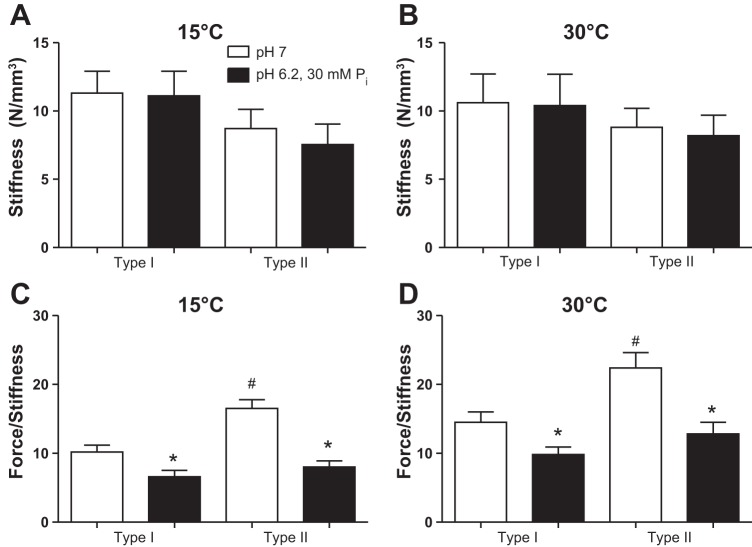
Fig. 8.
Stiffness (A and B) and the force-stiffness ratio (force/stiffness) (C and D) at pCa 4.5 in type I and II fibers at 15 and 30°C. Values are means ± SE, n = 9 and 12 slow and fast fibers, respectively, at each temperature from a total of 4 rats. *Significantly different from pH 7, P < 0.05. #Significantly different than type I fibers, P < 0.05. All values in D at 30°C are significantly higher than the values in C, P < 0.05.

