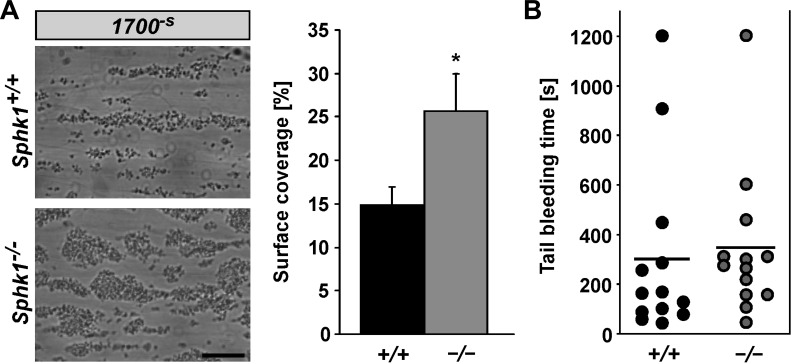
Fig. 4.
Thrombus formation and tail bleeding time of platelets from sphk1−/− and sphk1+/+ mice. A: original phase contrast images (left) of surface coverage by adherent platelets and arithmetic means ± SE (n = 6, right) following perfusion of whole blood from sphk1+/+ (black bar) and sphk1−/− (grey bar) mice over a collagen-coated surface for 5 min at high (1,700−s) arterial shear rates. Scale bar equals 50 μm. *P < 0.05, statistically significant difference from sphk1+/+ platelets. B: arithmetic means ± SE (n = 14) of tail bleeding time measured after amputating the tail tip of sphk1+/+ (black dots) and sphk1−/− (grey dots) mice. Each dot represents 1 individual; black bar represents the mean value.

