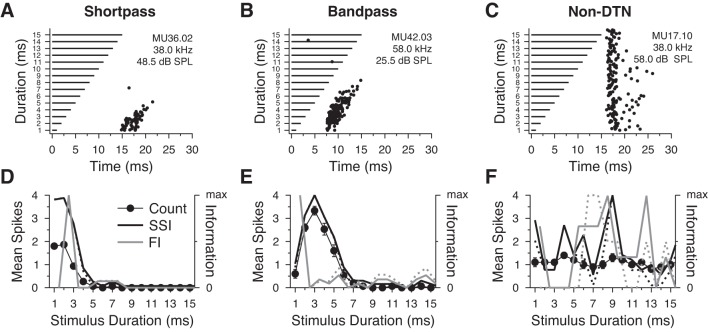
Fig. 3.
Examples of spiking responses and information content measures in 3 neurons from the ICc of the big brown bat. A and D: short-pass DTN, CVBD = 0.230, 15 trials/stimulus; B and E: band-pass DTN, CVBD = 0.217, 15 trials per stimulus; C and F: a non-DTN (all-pass neuron) with an onset response, 10 trials/stimulus. A–C: dot raster displays illustrating the timing of spikes (black dots) in response to stimulation with pure tones that were randomly varied in duration (horizontal black bars) and presented at the cell BEF at +20 dB above threshold. D–F: means ± SE spikes per stimulus (filled circles), normalized stimulus-specific information (SSI) where Pr(s = 0|d) ≥ 0 (black line; D: short-pass peak SSI = 3.42 bits; E: band-pass peak SSI = 2.83 bits; F: non-DTN peak SSI = 0.41 bits), normalized SSI where Pr(s = 0|d) = 0 (dashed black line; D: short-pass peak SSI = 3.42; E: band-pass peak SSI = 2.84; F: non-DTN peak SSI = 0.47 bits), normalized estimated Fisher information (FI) where Pr(s = 0|d) ≥ 0 (solid gray line), and normalized estimated FI where Pr(s = 0|d) = 0 (dashed gray line) as a function of stimulus duration. Note that the peak FI, a measure of sensitivity, does not need to align near the peak spike count or peak SSI as in D and E. Information measures were similar in both DTNs regardless of whether we included or excluded responses with zero spikes per stimulus. For the non-DTN, both the SSI and FI fluctuated randomly across the stimulus domain and were essentially a function of the trial-to-trial variance in spiking.

