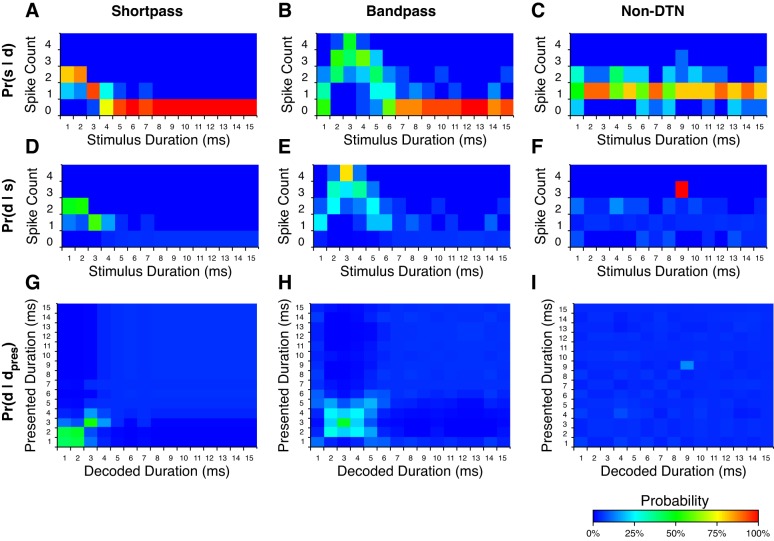
Fig. 6.
Examples of response, posterior, and decoding probability distributions for 3 neurons from the IC of the big brown bat. See Fig. 3 for the dot raster displays and duration tuning profiles of each cell. A–C: probability of s spikes being evoked given the presentation of stimulus duration d; Pr(s|d) for s ∈ [0, 1, 2, 3, 4] spikes per trial and stimulus durations d ∈ [1, 2, …, 25] ms (values from 16 to 25 ms not shown due to consistent near zero responses). D–F: probability of stimulus duration d having occurred given that s spikes were evoked; Pr(d|s) for the same spike counts and stimulus durations as above calculated using Bayes' formula with naive priors. G–I: stimulus duration decoding matrices for example neurons. These matrices can be interpreted as the probability that stimulus duration d would be decoded given that stimulus duration dpres was presented; Pr(d|dpres), over all stimulus durations d and presented stimulus durations dpres. Note that stimulus durations with the highest decoding probabilities correspond to the stimulus durations with the highest evoked spike counts, with both DTNs outperforming the non-DTN.

