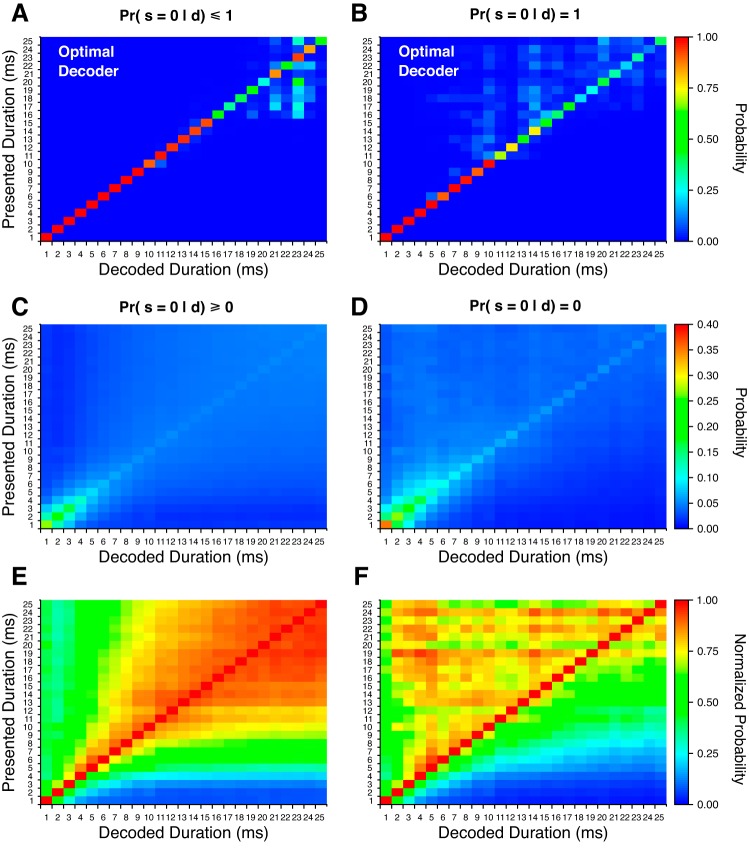
Fig. 7.
Posterior response probability matrices from population spike count responses. Estimated optimal decoding probabilities with spike counts across all decoded stimulus durations given the presentation of all stimulus durations [i.e., Pr(d|dpres)] when including responses with zero spikes per stimulus (A) and when ignoring responses with zero spikes per stimulus (B). Nonoptimal decoder with spike counts as the average duration decoding matrix over all DTNs when including responses with zero spikes per stimulus (C) and when ignoring responses with zero spikes per stimulus (D). Note that the probability scale in C and D runs from 0 to 0.4 for improved contrast. E and F: same data as in C and D with each row normalized to the highest probability value across all decoded durations.

