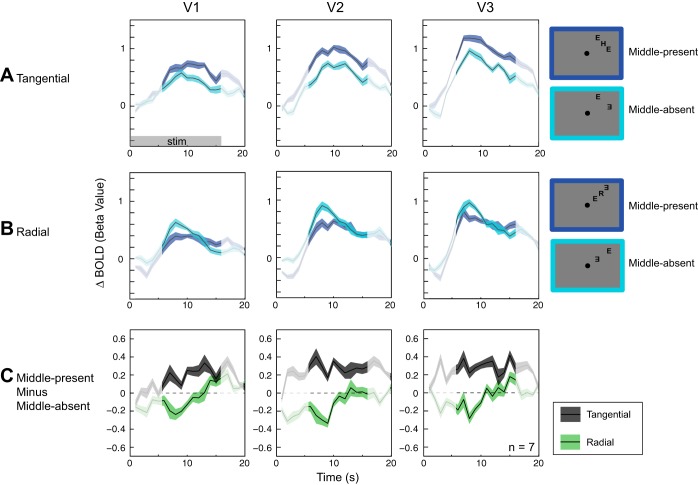
Fig. 3.
Anisotropy in blood oxygenation level-dependent (BOLD) response. A: tangentially arranged flankers. Cyan lines indicate fMRI BOLD responses to the middle-absent condition, while blue lines represent BOLD responses to the middle-present condition. Adding a middle letter led to a slight increase in mean BOLD response in the ROIs that encompassed the flankers and the middle letter. B: radially arranged flankers. Adding a middle letter resulted in a noticeable decrease in mean BOLD response in the ROIs. C: difference in BOLD response between middle-present and middle-absent for the tangential configuration (gray lines) and the radial configuration (green lines). Significant signal reduction was observed in the radial condition compared with the tangential condition. Highlighted time points (6–16 s) were used in the statistical analysis (see text). Shaded areas represent ±1 within-subject SE. Because the present study adopted a within-subject design for its statistical analysis, the relevant SE is the within-subject SE (Loftus and Masson 1994). Unless otherwise stated, all SEs are within-subject SEs.

