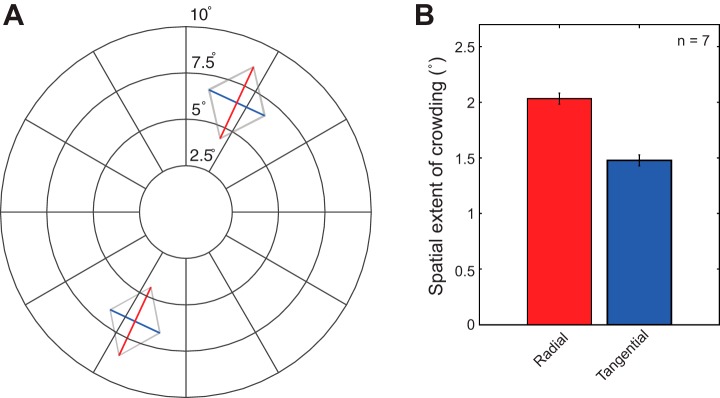
Fig. 4.

Anisotropy in the spatial extent of crowding. A: spatial extent of crowding measured at the 2 testing locations used in the fMRI experiment, averaged across subjects. Red lines indicate the spatial extent of crowding for the radial configuration, while blue lines represent that for the tangential configuration. It is evident that the spatial extent of crowding is elongated along the radial axis connecting the target (middle letter) with the fovea for both testing locations. Thin shaded contours indicate ±1 within-subject SE. B: mean spatial extent of crowding averaged across testing locations and subjects. Our results showed a significantly larger spatial extent of crowding for the radial configuration than the tangential configuration [2-tailed pairwise t-test: t(6) = 3.61, P = 0.01]. Error bars represent ±1 within-subject SE.
