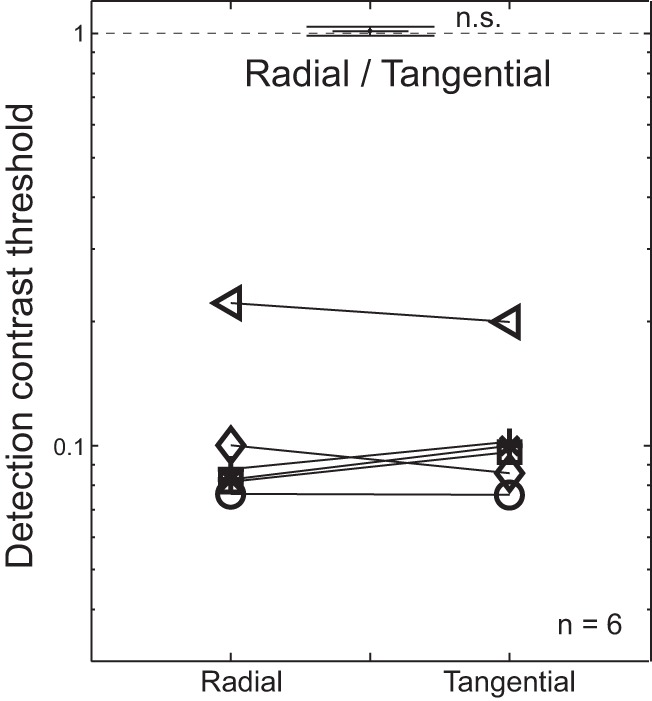
Fig. 6.

No anisotropy in flanked letter detection threshold. Contrast thresholds for middle letter detection are plotted as a function of flanker configuration. Each symbol represents the detection threshold of a single subject. The mean ratio of radial to tangential detection threshold across subjects is shown at top. Error bars indicate ±1 within-subject SE. n.s., Not significant.
