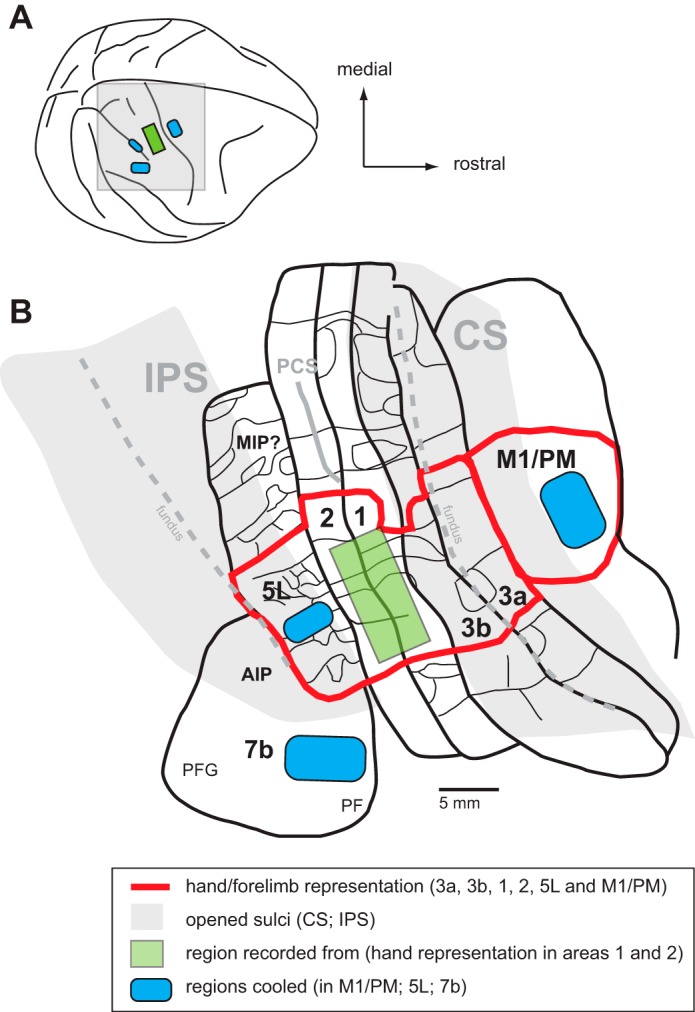
Fig. 1.

A composite diagram of cooling chip placement relative to sulcal landmarks and cortical field maps. A: dorsolateral view of the monkey neocortex with the region of interest shaded gray. B: enlargement of the shaded region in A showing the location of areas 3a, 3b, 1, 2, M1/PM, 5L, and 7b (thick black lines) relative to each other and to the central sulcus (CS) and intraparietal sulcus (IPS). These sulci have been opened (gray shading) so that all cortical fields can be seen. Parietal areas 3a, 3b, 1, 2, and 5L have been mapped in detail in previous studies. Functional divisions between body part representations are shown in some fields (thin black lines); the hand representation in each area is outlined in red. Likewise, the location and organization of the motor hand representation have been identified in previous studies using microstimulation techniques. Note that the hand representation across these motor/parietal fields is consistently located at the same mediolateral level so that recordings in areas 3a, 1, and 2, as well as sulcal landmarks, allow for accurate placement of cooling chips in areas M1/PM and 5L. Area 7b has also been described in previous studies, and its location relative to the tip of the IPS has been well established. The blue shading indicates the locations of our cooling chips in the different monkeys: on the gyral surface of areas M1/PM and 7b and in the IPS in area 5. The green rectangle in areas 1 and 2 represents the location in the hand/forearm representation where electrophysiological recordings were made. This illustration has been modified from Seelke et al. (2012) with permission and also includes maps redrawn from Nelson et al. (1980) and Godschalk et al. (1995) with permission. See Table 3 for abbreviations.
