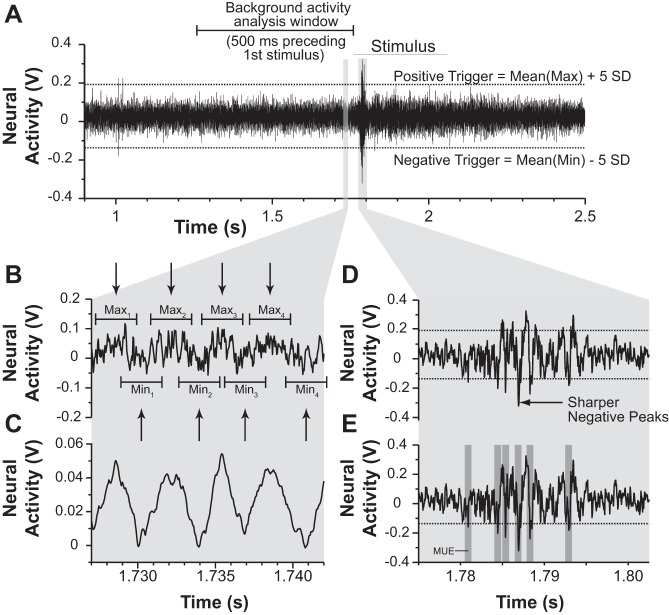
Fig. 3.
Illustration depicting how stimulus-driven neural responses were quantified. A: the 500 ms preceding the first automated stimulus was analyzed in order to calculate the mean and SD of background activity. The window of time analyzed is shown as the areas within the bracket above the voltage trace. B: expanded view of 15 ms within the analysis window. The raw neural activity can be seen as an oscillating waveform with noise and background activity superimposed over it. The goal was to find the mean and SD of the positive (peaks) component and the negative component (troughs) of the noise. C: to detect the peaks and troughs automatically, the raw trace was smoothed with a 0.1- to 0.5-ms window. This allowed for automatic peak and trough detection (black arrows) that could be aligned to the raw activity trace (shown in B). Maxima and minima of the peaks and troughs of the raw activity trace were collected by centering a sampling window over the peaks and troughs of the smoothed trace and sampling from the raw trace. The mean maxima and minima were used to calculate positive and negative trigger levels (shown in A) for detection of multiunit events. D: expanded view of stimulus-driven activity shown in A. The polarity of the chosen trigger level was determined by visualizing which component of the spikes (positive or negative) had the highest amplitude and thinnest width. In this example, the negative components of the spikes peaked more sharply (arrow) and at higher amplitude than the positive components, so a negative trigger level is chosen. E: multiunit events were defined as any crossing of the chosen trigger level/polarity. Only 1 multiunit event (MUE) was counted in a 0.8-ms window (dark gray shading) centered on the trigger crossing. Trigger levels were calculated independently for each recording epoch. However, the polarity of the trigger levels remained constant for the entire deactivation test.

