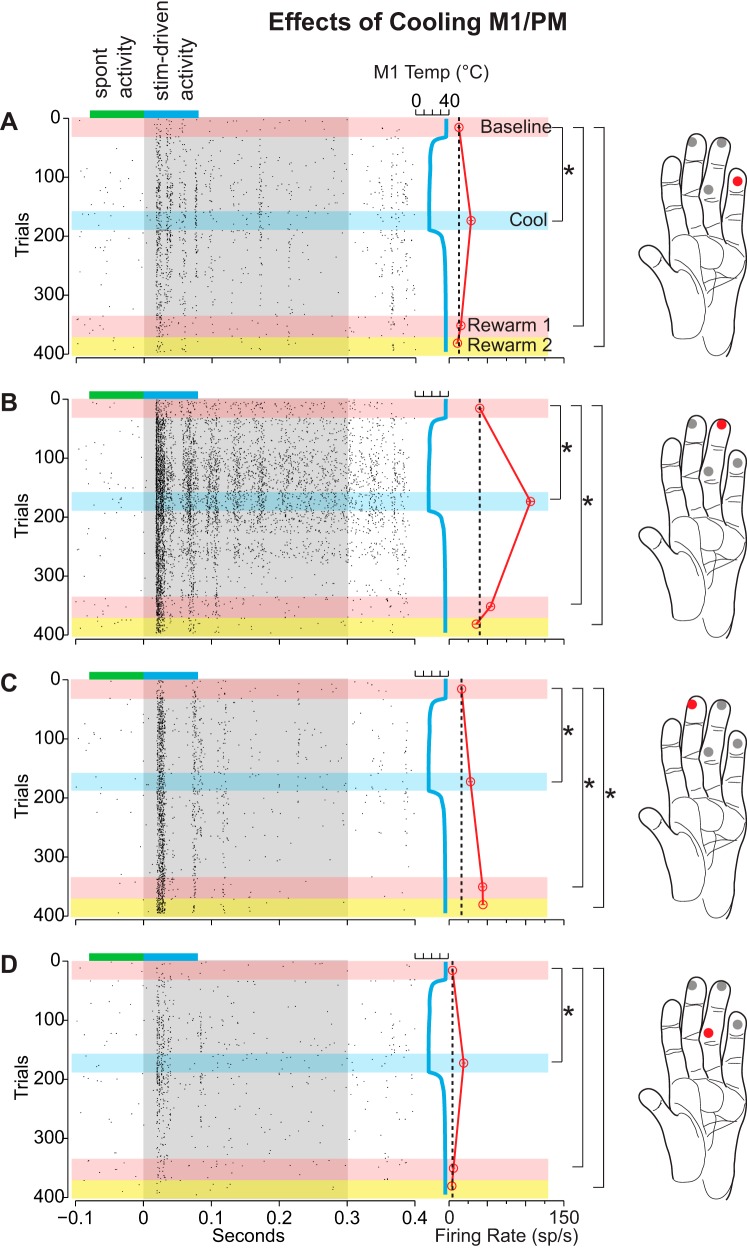
Fig. 5.
Differential changes in the neural responses of area 1/2 neurons during cooling of M1/PM for case 12-149. Presentation of stimuli at different locations was interleaved (see Stimulation paradigm). This example illustrates an increase in firing rate with cooling for all 4 stimulation sites on the hand and, for location C, a persistent and enhanced effect. While cooling produced a significant increase in response at each stimulation location, only locations A, B, and D returned to a baseline level of responsiveness after warming. Conventions are the same as Fig. 4 (except that the pink horizontal bar indicates the rewarm 1 epoch and the yellow horizontal bar indicates the rewarm 2 epoch).

