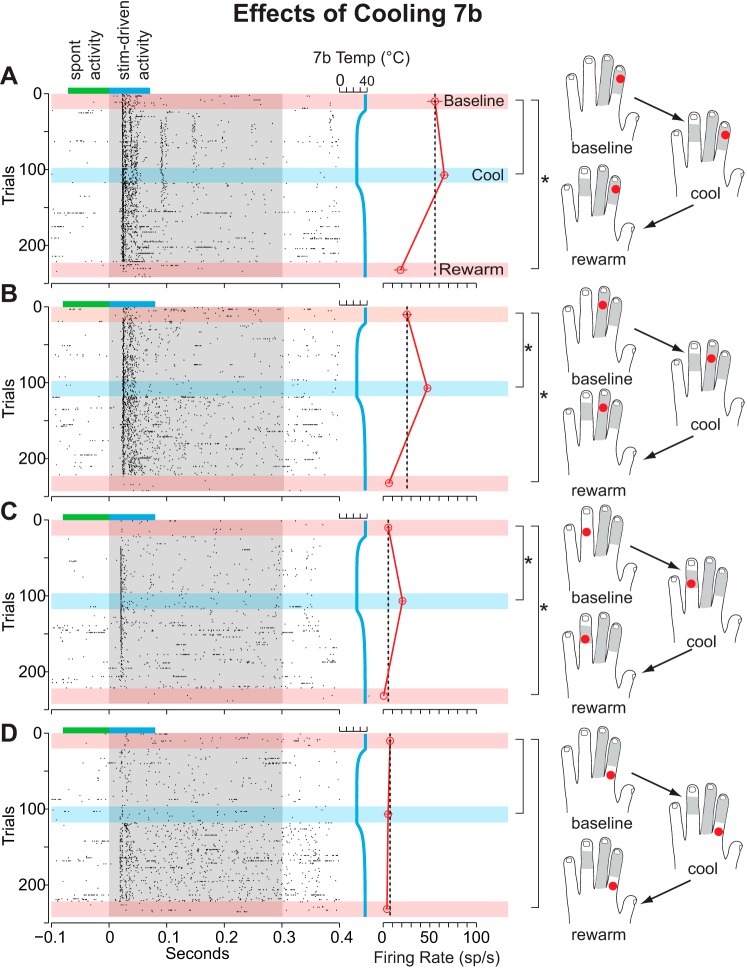
Fig. 7.
Example of the differential changes in the neural responses of area 1/2 neurons during cooling of area 7b in case 12-59 coregistered with the hand mapping data. Gray shaded region on each model hand denotes the extent of the hand-mapped receptive field during each recording epoch. At baseline, stimulation of locations A and B elicited a neural response, while stimulation at locations C and D had a negligible response. Cooling produced a significant increase in the response of area 1/2 neurons to stimulation at site B, and a previously unseen response emerged by stimulating site C during cooling. Conventions are the same as in Figs. 4 and 5.

