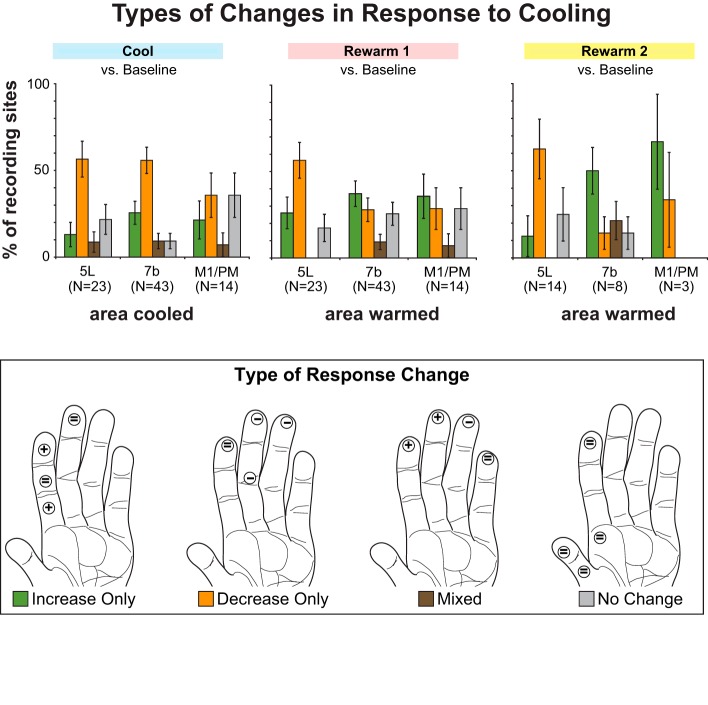
Fig. 8.
Proportion of recording sites displaying different types of activity changes (color coded in key and graphically represented on a diagram of the hand) in response to cooling and rewarming areas 5L or 7b or M1/PM. For each recording epoch (top) % of sites showing 1 of 4 activity patterns was calculated. Error bars = SE. “Increase Only” (green): cooling or rewarming induced a significant (P < 0.025, 2-tailed test) increase in the neuronal response to stimulation of 1 or more of the 4 locations on the hand that were stimulated. The hand depicted (bottom) illustrates the response to cooling area 7b at recording site 5 in case 12-150. The response to stimulation increases at 2 locations (plus signs) but remains unchanged at the other 2 (equal signs). “Decrease Only” (orange): same definition as above, but for significant decreases in neuronal response. The hand illustrates the response to cooling area 5L at site 2 in case 12-149. The response to stimulation decreases at 3 locations (minus signs) but remains unchanged at the 4th. “Mixed” (brown): cooling or rewarming induced a decrease in response to stimulation for at least 1 location and an increase in response at 1 or more other stimulation locations. The hand illustrates the response to cooling area 5L at site 33 from case 11-186. Two locations show an increase in response to stimulation, 1 shows a decrease, and the 4th remains unchanged. “No Change” (gray): cooling or warming did not induce any significant changes in neuronal response to stimulation of any tested stimulation locations on the hand. The hand illustrates the response to cooling M1/PM at site 31 from case 12-149. None of the locations shows any change in response to stimulation during compared with baseline.

