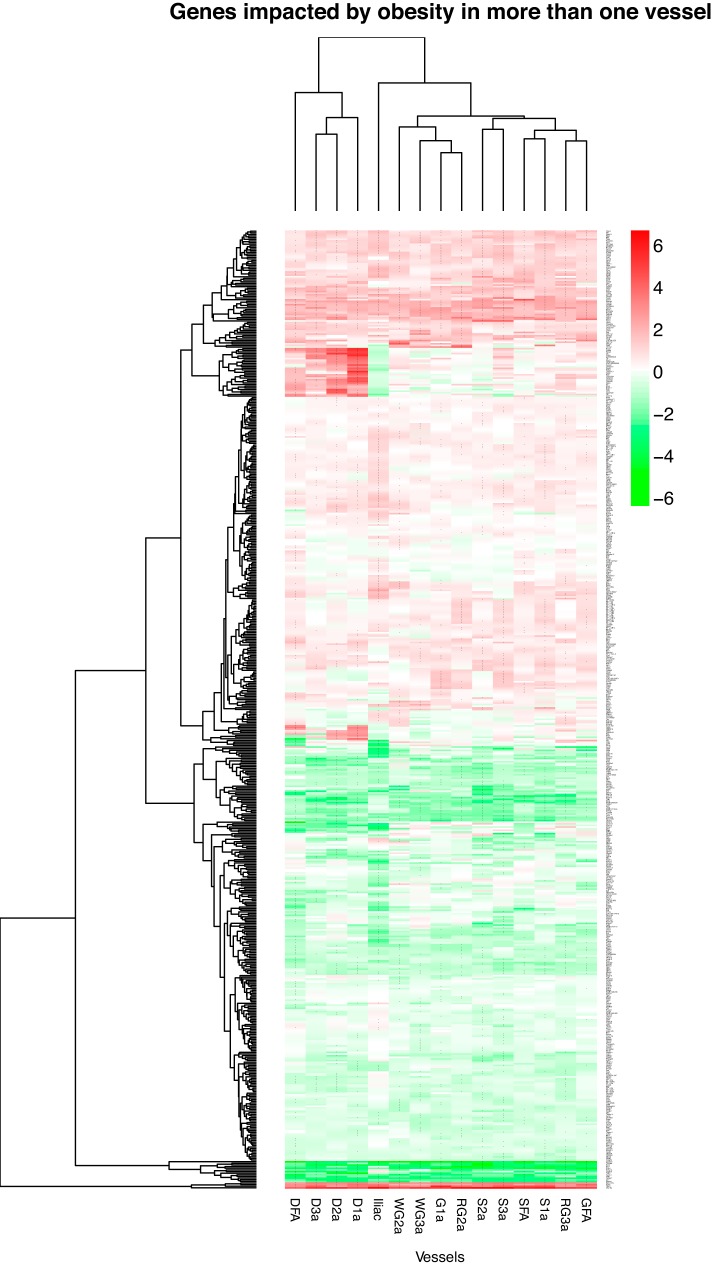
Fig. 5.
Heat-map of 587 genes significantly affected by obesity in >1 artery out of the 15 arteries. Shading is in proportion to the size of the fold difference (red, upregulation; green, downregulation; log2 fold difference). Rows are genes and columns are vessels. Zoom-in function is needed to discern the name of the genes. *Fold changes (OS/LS) that were significant at false discovery rate < 0.10.

