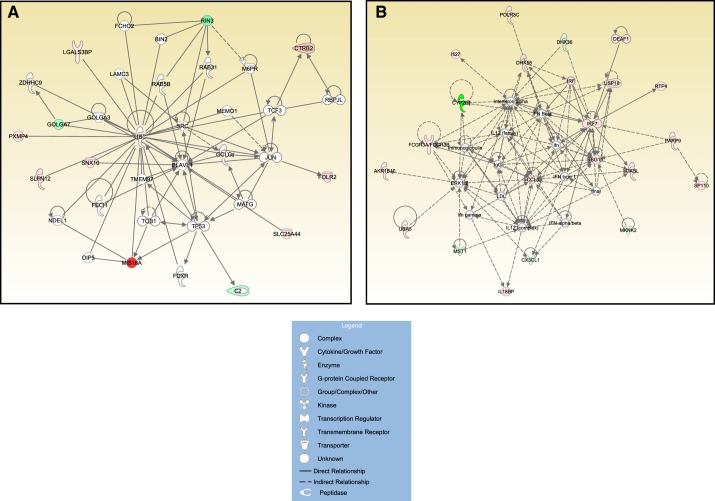
Fig. 8.
A: top significant Ingenuity Pathway Analysis (IPA) gene network using the 20 genes consistently affected by obesity across all 15 arteries (score 28). B: top significant IPA gene network using a list of 97 genes that corresponds to the number of genes affected by obesity in 8 or more arteries out of the 15 arteries (score 44). Solid and dotted lines denote direct and indirect relationships, respectively, between genes/molecules.

